Movie
Movie Controller


+ Open data

- Basic information
| Entry | Database: EMDB / ID: EMD-5404 | |||||||||
|---|---|---|---|---|---|---|---|---|---|---|
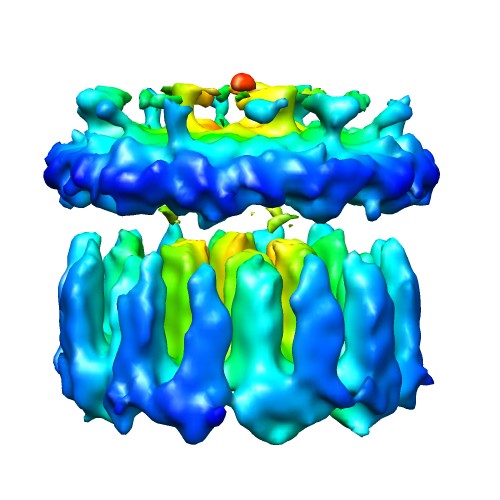
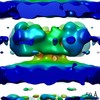
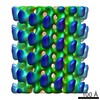
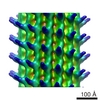
| Title | Molecular Architecture of Chemoreceptor Array in E. coli | |||||||||
 Map data Map data | This in situ structure of chemoreceptor array was determined by using cryo-electron tomography of E. coli minicell | |||||||||
 Sample Sample |
| |||||||||
 Keywords Keywords | Bacterial Chemotaxis Chemoreceptor array Signaling Transduction Minicell cryo-electron tomography | |||||||||
| Biological species |  | |||||||||
| Method | subtomogram averaging / cryo EM / negative staining / Resolution: 32.0 Å | |||||||||
 Authors Authors | Liu J / Hu B / Morado DR / Jani S / Manson MD / Margolin W | |||||||||
 Citation Citation | Journal: Proc Natl Acad Sci U S A / Year: 2012 Title: Molecular architecture of chemoreceptor arrays revealed by cryoelectron tomography of Escherichia coli minicells. Authors: Jun Liu / Bo Hu / Dustin R Morado / Sneha Jani / Michael D Manson / William Margolin /  Abstract: The chemoreceptors of Escherichia coli localize to the cell poles and form a highly ordered array in concert with the CheA kinase and the CheW coupling factor. However, a high-resolution structure of ...The chemoreceptors of Escherichia coli localize to the cell poles and form a highly ordered array in concert with the CheA kinase and the CheW coupling factor. However, a high-resolution structure of the array has been lacking, and the molecular basis of array assembly has thus remained elusive. Here, we use cryoelectron tomography of flagellated E. coli minicells to derive a 3D map of the intact array. Docking of high-resolution structures into the 3D map provides a model of the core signaling complex, in which a CheA/CheW dimer bridges two adjacent receptor trimers via multiple hydrophobic interactions. A further, hitherto unknown, hydrophobic interaction between CheW and the homologous P5 domain of CheA in an adjacent core complex connects the complexes into an extended array. This architecture provides a structural basis for array formation and could explain the high sensitivity and cooperativity of chemotaxis signaling in E. coli. | |||||||||
| History |
|
- Structure visualization
| Movie |
 Movie viewer Movie viewer |
|---|---|
| Structure viewer | EM map: SurfViewMolmilJmol/JSmol |
| Supplemental images |
- Downloads & links
-EMDB archive
| Map data | emd_5404.map.gz | 3.2 MB | EMDB map data format | |
|---|---|---|---|---|
| Header (meta data) | emd-5404-v30.xmlemd-5404.xml | 10.6 KB 10.6 KB | Display Display | EMDB header |
| Images |  emd_5404_1.jpg emd_5404_1.jpg | 51.4 KB | ||
| Archive directory |  http://ftp.pdbj.org/pub/emdb/structures/EMD-5404ftp://ftp.pdbj.org/pub/emdb/structures/EMD-5404 http://ftp.pdbj.org/pub/emdb/structures/EMD-5404ftp://ftp.pdbj.org/pub/emdb/structures/EMD-5404 | HTTPS FTP |
-Validation report
| Summary document | emd_5404_validation.pdf.gz | 77.9 KB | Display | EMDB validaton report |
|---|---|---|---|---|
| Full document | emd_5404_full_validation.pdf.gz | 77 KB | Display | |
| Data in XML | emd_5404_validation.xml.gz | 492 B | Display | |
| Arichive directory | https://ftp.pdbj.org/pub/emdb/validation_reports/EMD-5404ftp://ftp.pdbj.org/pub/emdb/validation_reports/EMD-5404 | HTTPS FTP |
-Related structure data
| Similar structure data |
|---|

-Links
| EMDB pages | EMDB (EBI/PDBe) / EMDataResource |
|---|
-Map
| File | Download / File: emd_5404.map.gz / Format: CCP4 / Size: 7.8 MB / Type: IMAGE STORED AS FLOATING POINT NUMBER (4 BYTES) | ||||||||||||||||||||||||||||||||||||||||||||||||||||||||||||||||||||
|---|---|---|---|---|---|---|---|---|---|---|---|---|---|---|---|---|---|---|---|---|---|---|---|---|---|---|---|---|---|---|---|---|---|---|---|---|---|---|---|---|---|---|---|---|---|---|---|---|---|---|---|---|---|---|---|---|---|---|---|---|---|---|---|---|---|---|---|---|---|
| Annotation | This in situ structure of chemoreceptor array was determined by using cryo-electron tomography of E. coli minicell | ||||||||||||||||||||||||||||||||||||||||||||||||||||||||||||||||||||
| Projections & slices | Image control
Images are generated by Spider. | ||||||||||||||||||||||||||||||||||||||||||||||||||||||||||||||||||||
| Voxel size | X=Y=Z: 5.7 Å | ||||||||||||||||||||||||||||||||||||||||||||||||||||||||||||||||||||
| Density |
| ||||||||||||||||||||||||||||||||||||||||||||||||||||||||||||||||||||
| Symmetry | Space group: 1 | ||||||||||||||||||||||||||||||||||||||||||||||||||||||||||||||||||||
| Details | EMDB XML:
CCP4 map header:
| ||||||||||||||||||||||||||||||||||||||||||||||||||||||||||||||||||||
 Z (Sec.)
 Y (Row.)
 X (Col.)


-Supplemental data
- Sample components
-Entire : Molecular Architecture of Chemoreceptor Arrays
| Entire | Name: Molecular Architecture of Chemoreceptor Arrays |
|---|---|
| Components |
|
-Supramolecule #1000: Molecular Architecture of Chemoreceptor Arrays
| Supramolecule | Name: Molecular Architecture of Chemoreceptor Arrays / type: sample / ID: 1000 / Details: The sample is E. coli minicell. / Number unique components: 3 |
|---|
-Supramolecule #1: Bacterial chemoreceptor arrays
| Supramolecule | Name: Bacterial chemoreceptor arrays / type: organelle_or_cellular_component / ID: 1 / Recombinant expression: No / Database: NCBI |
|---|---|
| Source (natural) | Organism: |
-Experimental details
-Structure determination
| Method | negative staining, cryo EM |
|---|---|
 Processing Processing | subtomogram averaging |
| Aggregation state | particle |
-Sample preparation
| Buffer | Details: tryptone broth |
|---|---|
| Staining | Type: NEGATIVE Details: Bacterial cultures were mixed with 15-nm colloidal gold (used as fiducial makers in image alignment) and then deposited onto freshly glow-discharged, holey carbon grids for 1 minute. The ...Details: Bacterial cultures were mixed with 15-nm colloidal gold (used as fiducial makers in image alignment) and then deposited onto freshly glow-discharged, holey carbon grids for 1 minute. The grids were blotted with filter paper and rapidly frozen in liquid ethane, using a gravity-driven plunger apparatus. |
| Grid | Details: 200 mesh holey carbon grids, glow discharged. |
| Vitrification | Cryogen name: ETHANE / Chamber humidity: 80 % / Chamber temperature: 90 K / Instrument: HOMEMADE PLUNGER Details: Grids were blotted for a few seconds before plunging into liquid ethane. Method: Blot for few seconds before plunging. |
- Electron microscopy
| Microscope | FEI POLARA 300 |
|---|---|
| Alignment procedure | Legacy - Astigmatism: Objective lens astigmatism was corrected at 200,000 times magnification |
| Date | Dec 1, 2010 |
| Image recording | Category: CCD / Film or detector model: GENERIC TVIPS (4k x 4k) / Number real images: 1024 / Average electron dose: 100 e/Å2 |
| Electron beam | Acceleration voltage: 300 kV / Electron source:  FIELD EMISSION GUN FIELD EMISSION GUN |
| Electron optics | Calibrated magnification: 31000 / Illumination mode: FLOOD BEAM / Imaging mode: BRIGHT FIELD / Cs: 2.0 mm / Nominal defocus max: 6.0 µm / Nominal defocus min: 4.0 µm / Nominal magnification: 31000 |
| Sample stage | Specimen holder: LN cooled / Specimen holder model: OTHER / Tilt series - Axis1 - Min angle: -65 ° / Tilt series - Axis1 - Max angle: 65 ° |
| Experimental equipment | 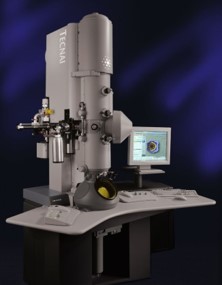 Model: Tecnai Polara / Image courtesy: FEI Company |
-Image processing
| Details | The particles were selected manually by visual inspection. The approximate local orientation of each small patch was estimated based on its location relative to the center of the minicell, therefore providing two of the three Euler angles. The sub-volume analysis of 2-D arrays was carried out by using Dr. Hanspeter Winkler's package. |
|---|---|
| Final reconstruction | Algorithm: OTHER / Resolution.type: BY AUTHOR / Resolution: 32.0 Å / Resolution method: FSC 0.5 CUT-OFF / Software - Name: IMOD,RAPTOR,PROTOMO / Number subtomograms used: 12483 |
| Final 3D classification | Number classes: 8 |
-Atomic model buiding 1
| Initial model | PDB ID: |
|---|---|
| Software | Name: Chimera |
| Details | Protocol: Rigid body |
| Refinement | Space: REAL / Protocol: RIGID BODY FIT |