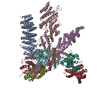
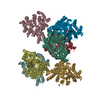
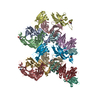
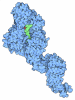
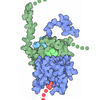
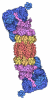
Journal: Elife / Year: 2020 Title: Structure and activation mechanism of the BBSome membrane protein trafficking complex. Authors: Sandeep K Singh / Miao Gui / Fujiet Koh / Matthew Cj Yip / Alan Brown / Abstract: Bardet-Biedl syndrome (BBS) is a currently incurable ciliopathy caused by the failure to correctly establish or maintain cilia-dependent signaling pathways. Eight proteins associated with BBS ...Bardet-Biedl syndrome (BBS) is a currently incurable ciliopathy caused by the failure to correctly establish or maintain cilia-dependent signaling pathways. Eight proteins associated with BBS assemble into the BBSome, a key regulator of the ciliary membrane proteome. We report the electron cryomicroscopy (cryo-EM) structures of the native bovine BBSome in inactive and active states at 3.1 and 3.5 Å resolution, respectively. In the active state, the BBSome is bound to an Arf-family GTPase (ARL6/BBS3) that recruits the BBSome to ciliary membranes. ARL6 recognizes a composite binding site formed by BBS1 and BBS7 that is occluded in the inactive state. Activation requires an unexpected swiveling of the β-propeller domain of BBS1, the subunit most frequently implicated in substrate recognition, which widens a central cavity of the BBSome. Structural mapping of disease-causing mutations suggests that pathogenesis results from folding defects and the disruption of autoinhibition and activation.
History
Deposition
Dec 19, 2019
-
Header (metadata) release
Jan 29, 2020
-
Map release
Jan 29, 2020
-
Update
Mar 6, 2024
-
Current status
Mar 6, 2024
Processing site: RCSB / Status: Released
-
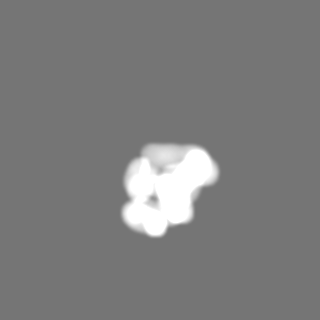
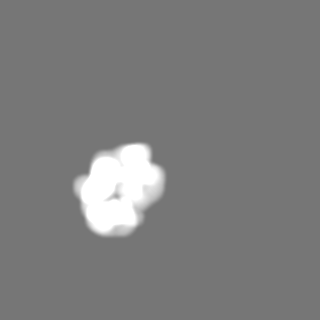
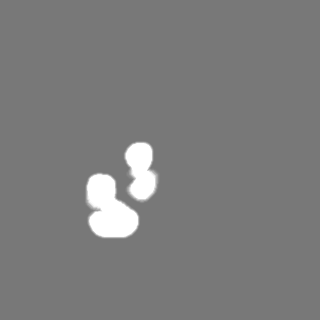
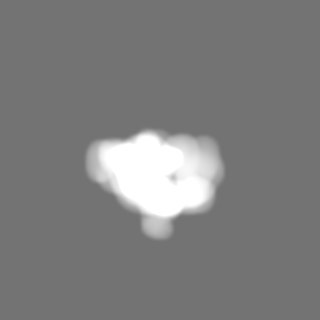
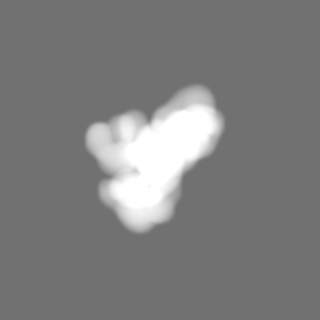
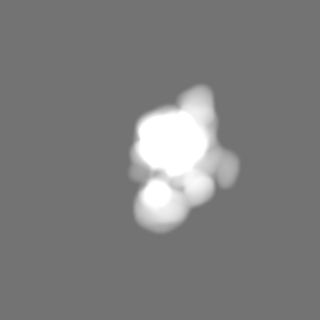
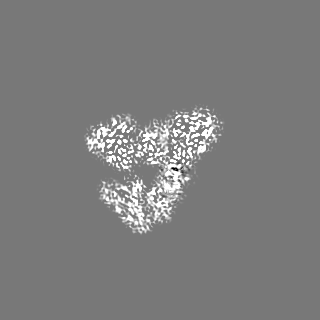
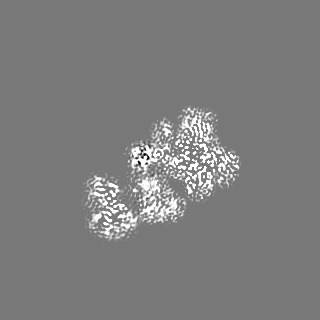
Structure visualization
Movie
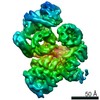
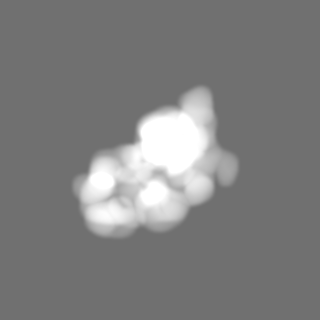
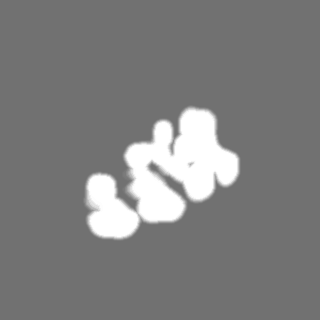
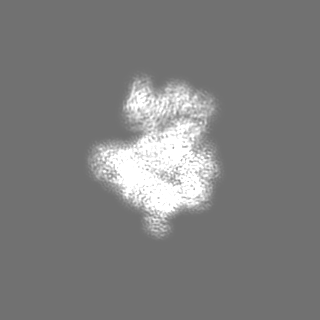
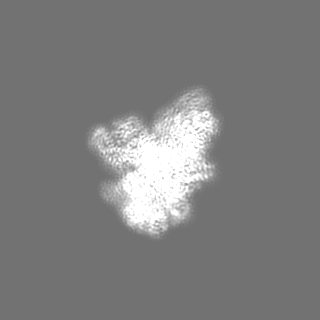
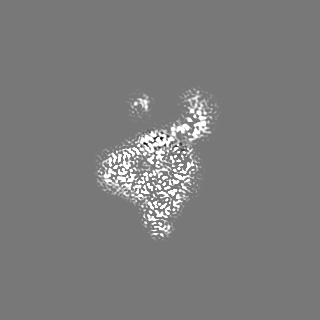
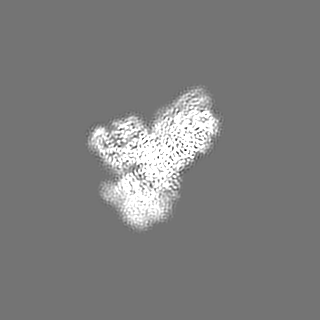
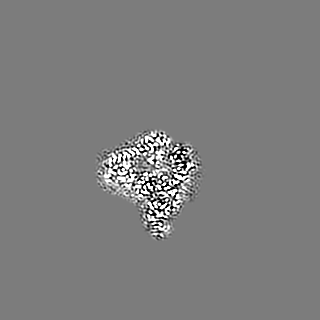
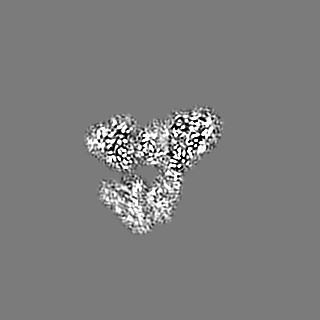
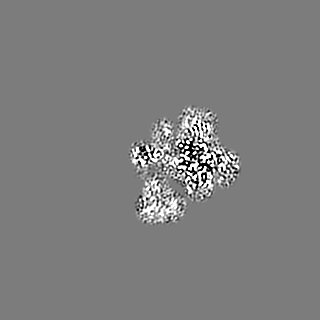
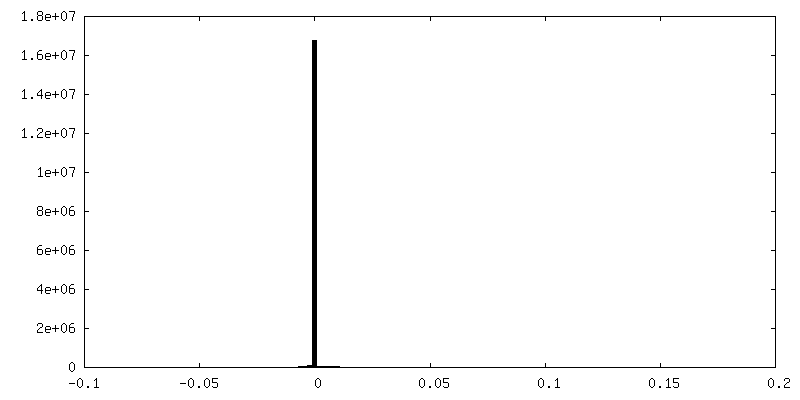
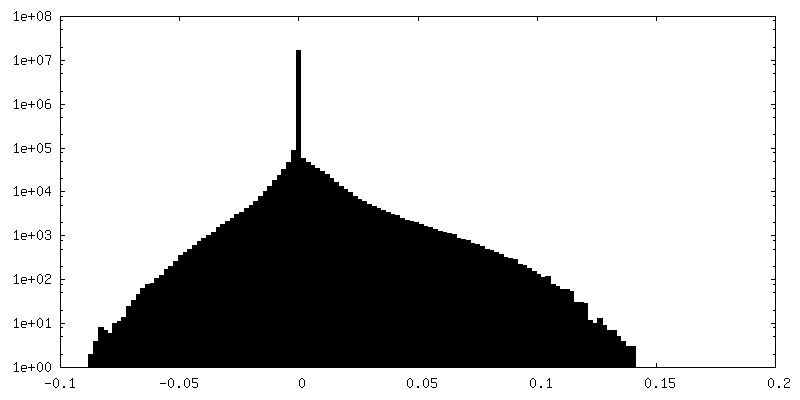
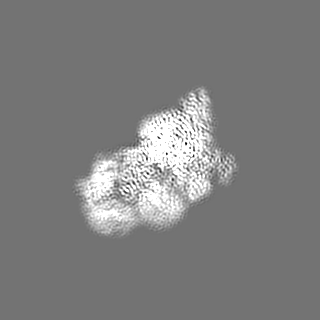
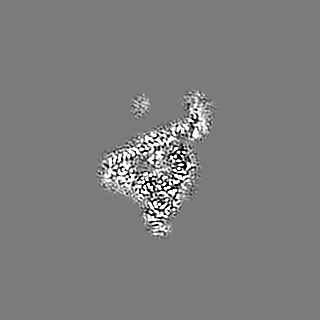
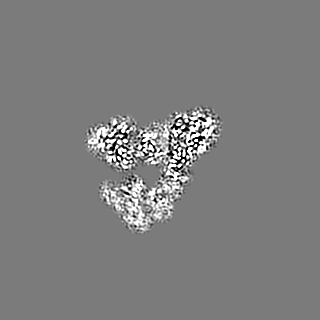
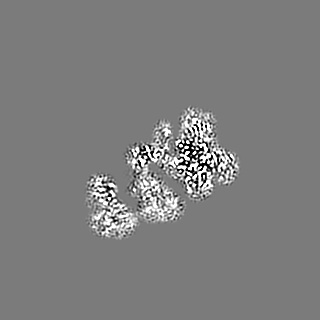
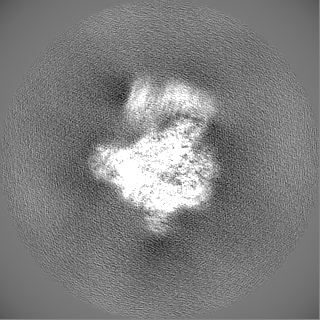
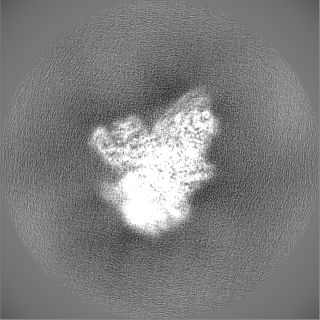
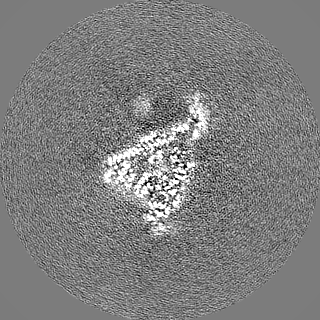
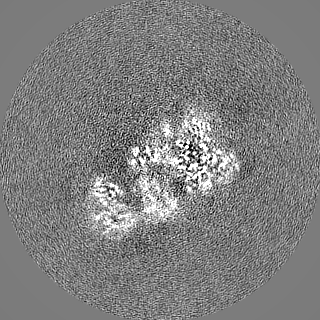
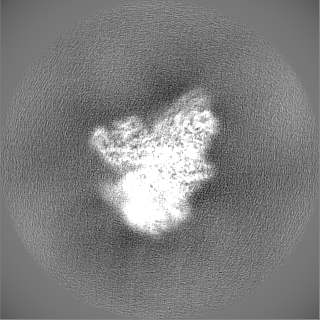
Surface view with section colored by density value
Name: CALCIUM ION / type: ligand / ID: 9 / Number of copies: 2 / Formula: CA
Molecular weight
Theoretical: 40.078 Da
-
Experimental details
-
Structure determination
Method
cryo EM
Processing
single particle reconstruction
Aggregation state
particle
-
Sample preparation
Concentration
0.7 mg/mL
Buffer
pH: 7.5 Component:
Concentration
Name
Formula
20.0 mM
Hepes
220.0 mM
NaCl
5.0 mM
MgCl2
4.0 mM
beta-mercaptoethanol
Details: The buffer also contained 36 uM ARL6 and 1 mM GTP.
Grid
Model: Quantifoil R1.2/1.3 / Material: GOLD / Mesh: 400 / Support film - Material: CARBON / Support film - topology: HOLEY / Pretreatment - Type: GLOW DISCHARGE / Pretreatment - Time: 30 sec. / Pretreatment - Atmosphere: AIR Details: The grids were glow discharged at 15 mA for 30 s with a PELCO easiGlow Glow Discharge Cleaning System.
Vitrification
Cryogen name: ETHANE / Chamber humidity: 100 % / Chamber temperature: 293 K / Instrument: FEI VITROBOT MARK II / Details: Grids were blotted for 2 s with a -2 offset..
-
Electron microscopy
Microscope
FEI TITAN KRIOS
Specialist optics
Energy filter - Name: GIF Bioquantum / Energy filter - Slit width: 25 eV
Image recording
Film or detector model: GATAN K3 BIOQUANTUM (6k x 4k) / Number grids imaged: 2 / Number real images: 9408 / Average exposure time: 4.0 sec. / Average electron dose: 56.0 e/Å2
Electron beam
Acceleration voltage: 300 kV / Electron source: FIELD EMISSION GUN
Type of model: OTHER Details: An initial map for the BBSome was generated using RELION's implementation of the stochastic gradient descent algorithm using default parameters and a mask diameter of 280 Angstrom.
Final reconstruction
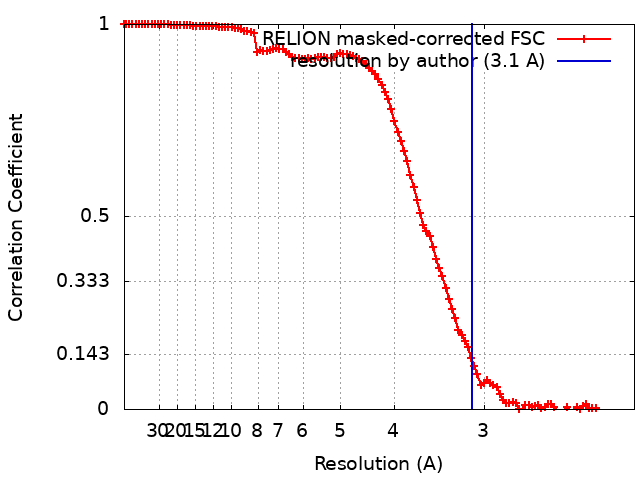
Applied symmetry - Point group: C1 (asymmetric) / Algorithm: BACK PROJECTION / Resolution.type: BY AUTHOR / Resolution: 3.1 Å / Resolution method: FSC 0.143 CUT-OFF / Software - Name: RELION (ver. 3.0) / Number images used: 152942
Initial angle assignment
Type: MAXIMUM LIKELIHOOD / Software - Name: RELION (ver. 3.0)
Final angle assignment
Type: MAXIMUM LIKELIHOOD / Software - Name: RELION (ver. 3.0)
Final 3D classification
Number classes: 8 / Software - Name: RELION (ver. 3.0)
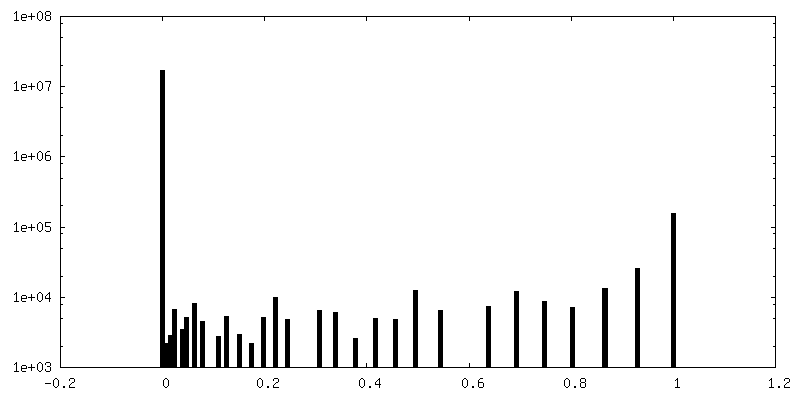
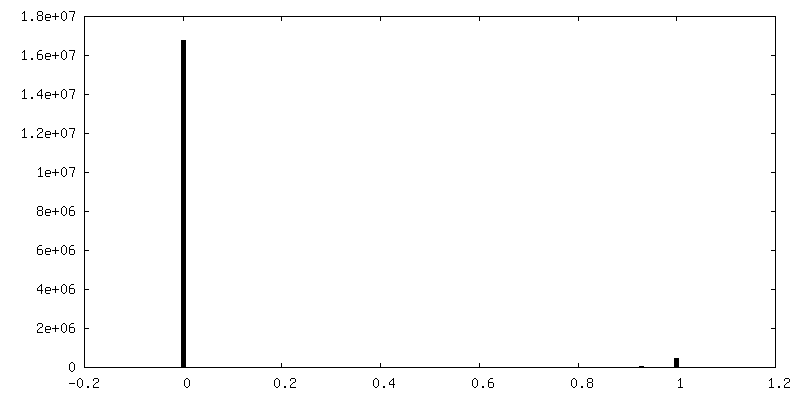
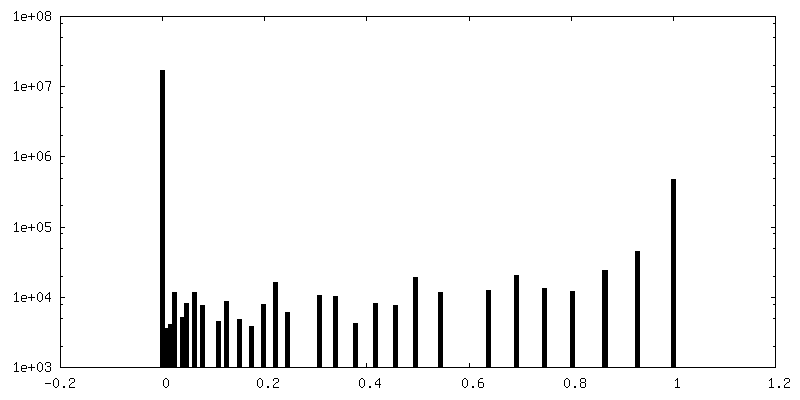
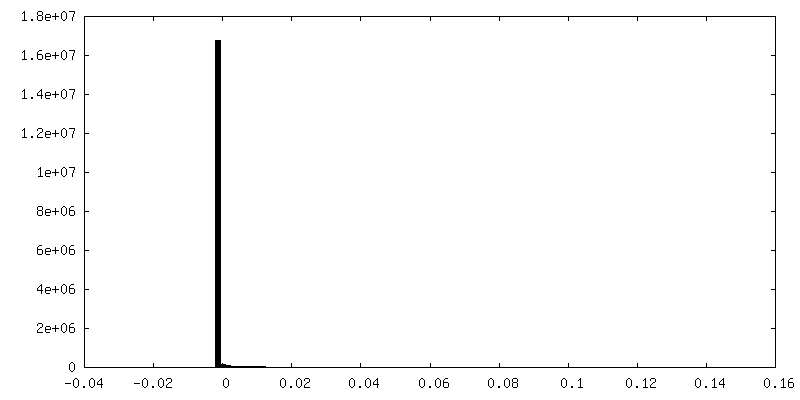
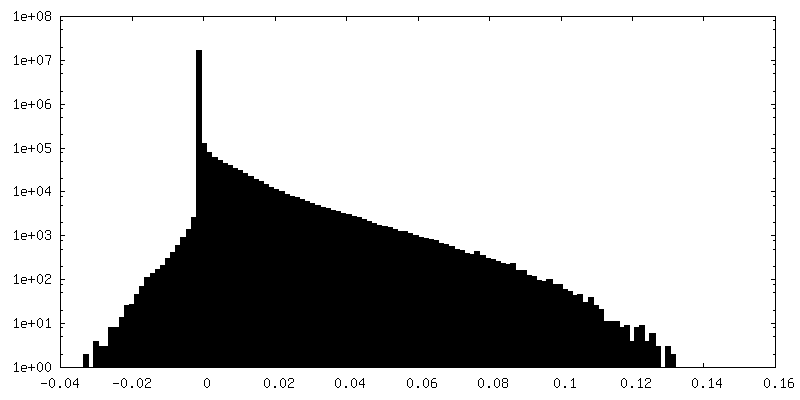
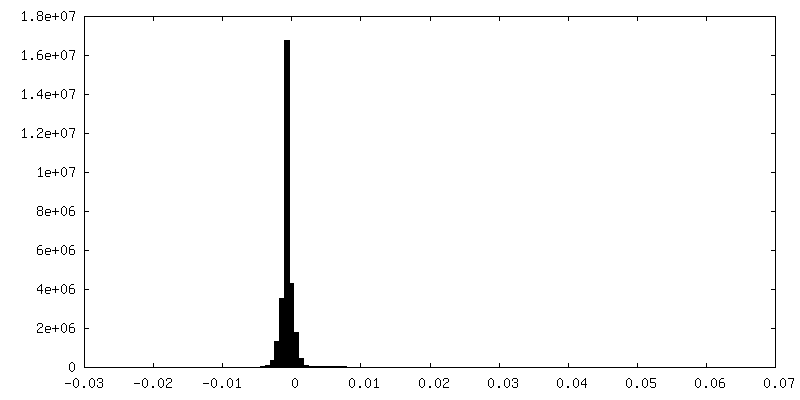
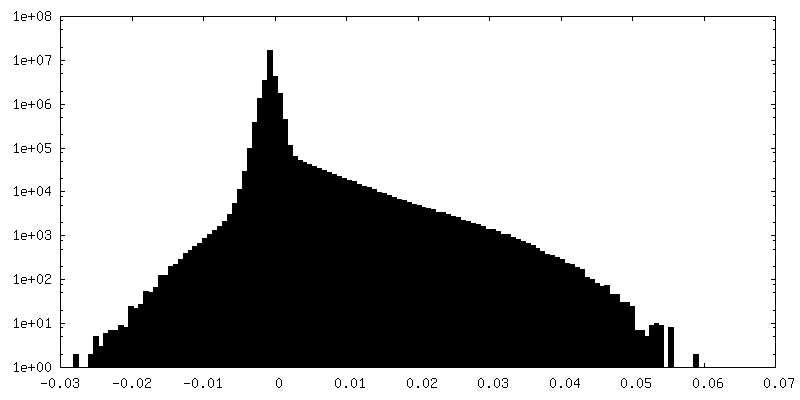
FSC plot (resolution estimation)
-
Atomic model buiding 1
Details
During refinement, the resolution limit was set to 3.1 Angstrom. Secondary structure, Ramachandran and rotamer restraints were applied during refinement.
Refinement
Space: REAL / Protocol: OTHER / Overall B value: 43.6 / Target criteria: Correlation coefficient
In the structure databanks used in Yorodumi, some data are registered as the other names, "COVID-19 virus" and "2019-nCoV". Here are the details of the virus and the list of structure data.
Jan 31, 2019. EMDB accession codes are about to change! (news from PDBe EMDB page)
EMDB accession codes are about to change! (news from PDBe EMDB page)
The allocation of 4 digits for EMDB accession codes will soon come to an end. Whilst these codes will remain in use, new EMDB accession codes will include an additional digit and will expand incrementally as the available range of codes is exhausted. The current 4-digit format prefixed with “EMD-” (i.e. EMD-XXXX) will advance to a 5-digit format (i.e. EMD-XXXXX), and so on. It is currently estimated that the 4-digit codes will be depleted around Spring 2019, at which point the 5-digit format will come into force.
The EM Navigator/Yorodumi systems omit the EMD- prefix.
Related info.:Q: What is EMD? / ID/Accession-code notation in Yorodumi/EM Navigator
Yorodumi is a browser for structure data from EMDB, PDB, SASBDB, etc.
This page is also the successor to EM Navigator detail page, and also detail information page/front-end page for Omokage search.
The word "yorodu" (or yorozu) is an old Japanese word meaning "ten thousand". "mi" (miru) is to see.
Related info.:EMDB / PDB / SASBDB / Comparison of 3 databanks / Yorodumi Search / Aug 31, 2016. New EM Navigator & Yorodumi / Yorodumi Papers / Jmol/JSmol / Function and homology information / Changes in new EM Navigator and Yorodumi
 Movie
Movie Controller


 Open data
 Basic information
 Map data
 Sample
 Keywords
 Function and homology information
 Authors
 United States, 1 items
  Citation
 Structure visualization
 Downloads & links
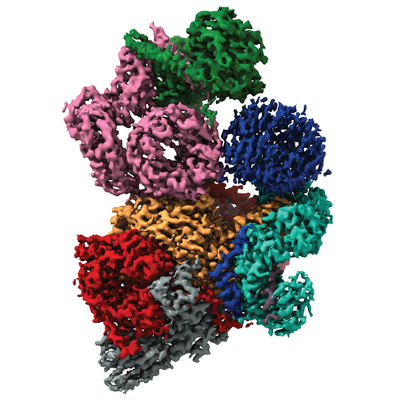 emd_21144.png
 http://ftp.pdbj.org/pub/emdb/structures/EMD-21144


 Z (Sec.)
 Y (Row.)
 X (Col.)


 Sample components
 Processing
 Electron microscopy
 FIELD EMISSION GUN