Movie
Movie Controller


+ Open data

- Basic information
| Entry | Database: EMDB / ID: EMD-11127 | |||||||||
|---|---|---|---|---|---|---|---|---|---|---|
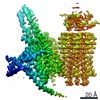
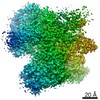
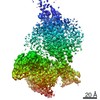
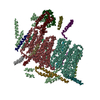
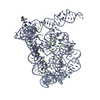
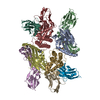
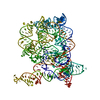
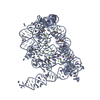
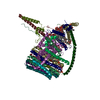
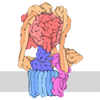
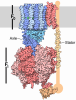
| Title | Fo domain of Ovine ATP synthase | |||||||||
 Map data Map data | Map of Fo domain, combined states | |||||||||
 Sample Sample |
| |||||||||
 Keywords Keywords | ATP synthase / mitochondrial / respiratory chain / mammalian / MEMBRANE PROTEIN | |||||||||
| Function / homology |  Function and homology information Function and homology information: / proton channel activity / proton transmembrane transporter activity / proton motive force-driven ATP synthesis / proton-transporting two-sector ATPase complex, proton-transporting domain / proton motive force-driven mitochondrial ATP synthesis / proton-transporting ATP synthase complex / proton-transporting ATP synthase activity, rotational mechanism / proton transmembrane transport / mitochondrial membrane ...: / proton channel activity / proton transmembrane transporter activity / proton motive force-driven ATP synthesis / proton-transporting two-sector ATPase complex, proton-transporting domain / proton motive force-driven mitochondrial ATP synthesis / proton-transporting ATP synthase complex / proton-transporting ATP synthase activity, rotational mechanism / proton transmembrane transport / mitochondrial membrane / mitochondrial inner membrane / lipid binding / mitochondrion Similarity search - Function | |||||||||
| Biological species |  | |||||||||
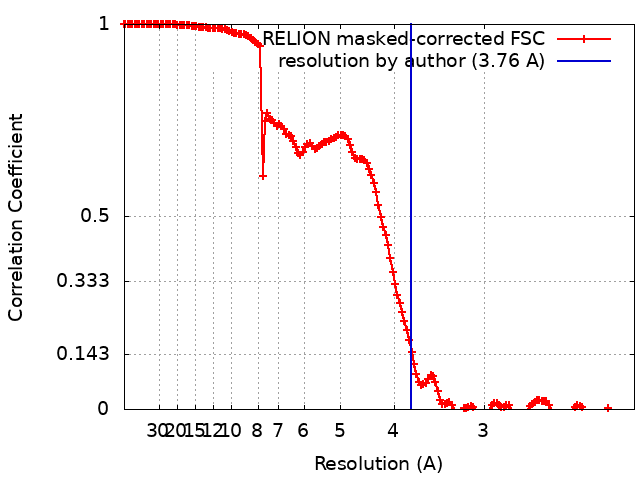
| Method | single particle reconstruction / cryo EM / Resolution: 3.76 Å | |||||||||
 Authors Authors | Pinke G / Zhou L | |||||||||
 Citation Citation | Journal: Nat Struct Mol Biol / Year: 2020 Title: Cryo-EM structure of the entire mammalian F-type ATP synthase. Authors: Gergely Pinke / Long Zhou / Leonid A Sazanov /  Abstract: The majority of adenosine triphosphate (ATP) powering cellular processes in eukaryotes is produced by the mitochondrial F1Fo ATP synthase. Here, we present the atomic models of the membrane Fo domain ...The majority of adenosine triphosphate (ATP) powering cellular processes in eukaryotes is produced by the mitochondrial F1Fo ATP synthase. Here, we present the atomic models of the membrane Fo domain and the entire mammalian (ovine) F1Fo, determined by cryo-electron microscopy. Subunits in the membrane domain are arranged in the 'proton translocation cluster' attached to the c-ring and a more distant 'hook apparatus' holding subunit e. Unexpectedly, this subunit is anchored to a lipid 'plug' capping the c-ring. We present a detailed proton translocation pathway in mammalian Fo and key inter-monomer contacts in F1Fo multimers. Cryo-EM maps of F1Fo exposed to calcium reveal a retracted subunit e and a disassembled c-ring, suggesting permeability transition pore opening. We propose a model for the permeability transition pore opening, whereby subunit e pulls the lipid plug out of the c-ring. Our structure will allow the design of drugs for many emerging applications in medicine. | |||||||||
| History |
|
- Structure visualization
| Movie |
Movie viewer |
|---|---|
| Structure viewer | EM map: SurfViewMolmilJmol/JSmol |
| Supplemental images |

- Downloads & links
-EMDB archive
| Map data | emd_11127.map.gz | 5 MB | EMDB map data format | |
|---|---|---|---|---|
| Header (meta data) | emd-11127-v30.xmlemd-11127.xml | 22.3 KB 22.3 KB | Display Display | EMDB header |
| FSC (resolution estimation) | emd_11127_fsc.xml | 15.3 KB | Display | FSC data file |
| Images | 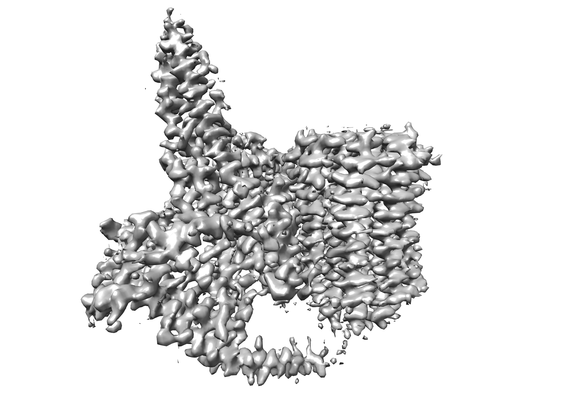 emd_11127.png emd_11127.png | 69.3 KB | ||
| Filedesc metadata | emd-11127.cif.gz | 6.9 KB | ||
| Archive directory |  http://ftp.pdbj.org/pub/emdb/structures/EMD-11127ftp://ftp.pdbj.org/pub/emdb/structures/EMD-11127 http://ftp.pdbj.org/pub/emdb/structures/EMD-11127ftp://ftp.pdbj.org/pub/emdb/structures/EMD-11127 | HTTPS FTP |
-Related structure data
| Related structure data |  6za9MC  6tt7C M: atomic model generated by this map C: citing same article ( |
|---|---|
| Similar structure data |
-Links
| EMDB pages | EMDB (EBI/PDBe) / EMDataResource |
|---|---|
| Related items in Molecule of the Month |
-Map
| File | Download / File: emd_11127.map.gz / Format: CCP4 / Size: 5.4 MB / Type: IMAGE STORED AS FLOATING POINT NUMBER (4 BYTES) | ||||||||||||||||||||||||||||||||||||||||||||||||||||||||||||||||||||
|---|---|---|---|---|---|---|---|---|---|---|---|---|---|---|---|---|---|---|---|---|---|---|---|---|---|---|---|---|---|---|---|---|---|---|---|---|---|---|---|---|---|---|---|---|---|---|---|---|---|---|---|---|---|---|---|---|---|---|---|---|---|---|---|---|---|---|---|---|---|
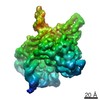
| Annotation | Map of Fo domain, combined states | ||||||||||||||||||||||||||||||||||||||||||||||||||||||||||||||||||||
| Projections & slices | Image control
Images are generated by Spider. generated in cubic-lattice coordinate | ||||||||||||||||||||||||||||||||||||||||||||||||||||||||||||||||||||
| Voxel size | X=Y=Z: 1.061 Å | ||||||||||||||||||||||||||||||||||||||||||||||||||||||||||||||||||||
| Density |
| ||||||||||||||||||||||||||||||||||||||||||||||||||||||||||||||||||||
| Symmetry | Space group: 1 | ||||||||||||||||||||||||||||||||||||||||||||||||||||||||||||||||||||
| Details | EMDB XML:
CCP4 map header:
| ||||||||||||||||||||||||||||||||||||||||||||||||||||||||||||||||||||
 X (Sec.)
 Y (Row.)
 Z (Col.)


-Supplemental data
- Sample components
+Entire : Fo domain of purified ATP synthase from sheep heart mitochondria
+Supramolecule #1: Fo domain of purified ATP synthase from sheep heart mitochondria
+Macromolecule #1: ATP synthase F(0) complex subunit C1, mitochondrial
+Macromolecule #2: ATP synthase subunit b
+Macromolecule #3: ATP synthase subunit d, mitochondrial
+Macromolecule #4: ATP synthase subunit a
+Macromolecule #5: ATP synthase membrane subunit DAPIT
+Macromolecule #6: ATP synthase membrane subunit 6.8PL
+Macromolecule #7: ATP synthase protein 8
+Macromolecule #8: ATP synthase membrane subunit f
+Macromolecule #9: ATP synthase subunit
+Macromolecule #10: ATP synthase subunit e, mitochondrial
+Macromolecule #11: 1,2-DIPALMITOYL-PHOSPHATIDYL-GLYCEROLE
+Macromolecule #12: CARDIOLIPIN
+Macromolecule #13: O-[(S)-hydroxy{[(2S)-2-hydroxy-3-(octadec-9-enoyloxy)propyl]oxy}p...
-Experimental details
-Structure determination
| Method | cryo EM |
|---|---|
 Processing Processing | single particle reconstruction |
| Aggregation state | particle |
-Sample preparation
| Concentration | 2.8 mg/mL |
|---|---|
| Buffer | pH: 7.4 Details: 20 mM HEPES pH7.4, 35 mM NaCl, 2 mM EDTA, 1% sucrose, 1 mM DTT, 0.1% LMNG, 0.2% CHAPS |
| Grid | Model: Quantifoil R0.6/1 / Material: COPPER / Mesh: 400 / Pretreatment - Type: GLOW DISCHARGE / Pretreatment - Time: 120 sec. / Pretreatment - Atmosphere: AIR |
| Vitrification | Cryogen name: ETHANE-PROPANE / Chamber humidity: 100 % / Chamber temperature: 277 K / Instrument: FEI VITROBOT MARK IV |
- Electron microscopy
| Microscope | FEI TITAN KRIOS |
|---|---|
| Image recording | Film or detector model: FEI FALCON III (4k x 4k) / Detector mode: INTEGRATING / Digitization - Dimensions - Width: 4096 pixel / Digitization - Dimensions - Height: 4096 pixel / Number grids imaged: 1 / Number real images: 3053 / Average exposure time: 1.0 sec. / Average electron dose: 106.0 e/Å2 / Details: 40 frames per movie |
| Electron beam | Acceleration voltage: 300 kV / Electron source:  FIELD EMISSION GUN FIELD EMISSION GUN |
| Electron optics | Calibrated defocus max: 2.4 µm / Calibrated defocus min: 1.0 µm / Calibrated magnification: 131951 / Illumination mode: FLOOD BEAM / Imaging mode: BRIGHT FIELD / Cs: 2.7 mm |
| Sample stage | Specimen holder model: FEI TITAN KRIOS AUTOGRID HOLDER / Cooling holder cryogen: NITROGEN |
| Experimental equipment |  Model: Titan Krios / Image courtesy: FEI Company |