 Movie
Movie Controller


+ Open data

- Basic information
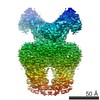
| Entry | Database: EMDB / ID: EMD-10326 | |||||||||
|---|---|---|---|---|---|---|---|---|---|---|
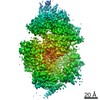
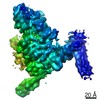
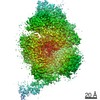
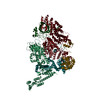
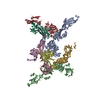
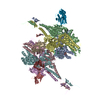
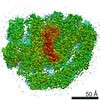
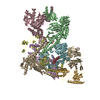
| Title | Structure of inactive GID E3 ubiquitin ligase complex | |||||||||
 Map data Map data | ||||||||||
 Sample Sample |
| |||||||||
| Biological species |  | |||||||||
| Method | single particle reconstruction / cryo EM / Resolution: 3.7 Å | |||||||||
 Authors Authors | Qiao S / Prabu JR / Schulman BA | |||||||||
| Funding support |  Germany, 1 items Germany, 1 items
| |||||||||
 Citation Citation | Journal: Mol Cell / Year: 2020 Title: Interconversion between Anticipatory and Active GID E3 Ubiquitin Ligase Conformations via Metabolically Driven Substrate Receptor Assembly. Authors: Shuai Qiao / Christine R Langlois / Jakub Chrustowicz / Dawafuti Sherpa / Ozge Karayel / Fynn M Hansen / Viola Beier / Susanne von Gronau / Daniel Bollschweiler / Tillman Schäfer / Arno F ...Authors: Shuai Qiao / Christine R Langlois / Jakub Chrustowicz / Dawafuti Sherpa / Ozge Karayel / Fynn M Hansen / Viola Beier / Susanne von Gronau / Daniel Bollschweiler / Tillman Schäfer / Arno F Alpi / Matthias Mann / J Rajan Prabu / Brenda A Schulman / Abstract: Cells respond to environmental changes by toggling metabolic pathways, preparing for homeostasis, and anticipating future stresses. For example, in Saccharomyces cerevisiae, carbon stress-induced ...Cells respond to environmental changes by toggling metabolic pathways, preparing for homeostasis, and anticipating future stresses. For example, in Saccharomyces cerevisiae, carbon stress-induced gluconeogenesis is terminated upon glucose availability, a process that involves the multiprotein E3 ligase GID recruiting N termini and catalyzing ubiquitylation of gluconeogenic enzymes. Here, genetics, biochemistry, and cryoelectron microscopy define molecular underpinnings of glucose-induced degradation. Unexpectedly, carbon stress induces an inactive anticipatory complex (GID), which awaits a glucose-induced substrate receptor to form the active GID. Meanwhile, other environmental perturbations elicit production of an alternative substrate receptor assembling into a related E3 ligase complex. The intricate structure of GID enables anticipating and ultimately binding various N-degron-targeting (i.e., "N-end rule") substrate receptors, while the GID E3 forms a clamp-like structure juxtaposing substrate lysines with the ubiquitylation active site. The data reveal evolutionarily conserved GID complexes as a family of multisubunit E3 ubiquitin ligases responsive to extracellular stimuli. | |||||||||
| History |
|
- Structure visualization
| Movie |
 Movie viewer Movie viewer |
|---|---|
| Structure viewer | EM map: SurfViewMolmilJmol/JSmol |
| Supplemental images |

- Downloads & links
-EMDB archive
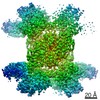
| Map data | emd_10326.map.gz | 7.2 MB | EMDB map data format | |
|---|---|---|---|---|
| Header (meta data) | emd-10326-v30.xmlemd-10326.xml | 17.5 KB 17.5 KB | Display Display | EMDB header |
| FSC (resolution estimation) | emd_10326_fsc.xml | 10 KB | Display | FSC data file |
| Images |  emd_10326.png emd_10326.png | 66 KB | ||
| Masks | emd_10326_msk_1.map | 83.7 MB | Mask map | |
| Others | emd_10326_additional.map.gzemd_10326_additional_1.map.gzemd_10326_half_map_1.map.gzemd_10326_half_map_2.map.gz | 5.4 MB 5.4 MB 65.4 MB 65.3 MB | ||
| Archive directory |  http://ftp.pdbj.org/pub/emdb/structures/EMD-10326ftp://ftp.pdbj.org/pub/emdb/structures/EMD-10326 http://ftp.pdbj.org/pub/emdb/structures/EMD-10326ftp://ftp.pdbj.org/pub/emdb/structures/EMD-10326 | HTTPS FTP |
-Related structure data


-Links
| EMDB pages | EMDB (EBI/PDBe) / EMDataResource |
|---|
-Map
| File | Download / File: emd_10326.map.gz / Format: CCP4 / Size: 83.7 MB / Type: IMAGE STORED AS FLOATING POINT NUMBER (4 BYTES) | ||||||||||||||||||||||||||||||||||||||||||||||||||||||||||||
|---|---|---|---|---|---|---|---|---|---|---|---|---|---|---|---|---|---|---|---|---|---|---|---|---|---|---|---|---|---|---|---|---|---|---|---|---|---|---|---|---|---|---|---|---|---|---|---|---|---|---|---|---|---|---|---|---|---|---|---|---|---|
| Projections & slices | Image control
Images are generated by Spider. | ||||||||||||||||||||||||||||||||||||||||||||||||||||||||||||
| Voxel size | X=Y=Z: 1.06 Å | ||||||||||||||||||||||||||||||||||||||||||||||||||||||||||||
| Density |
| ||||||||||||||||||||||||||||||||||||||||||||||||||||||||||||
| Symmetry | Space group: 1 | ||||||||||||||||||||||||||||||||||||||||||||||||||||||||||||
| Details | EMDB XML:
CCP4 map header:
| ||||||||||||||||||||||||||||||||||||||||||||||||||||||||||||
 Z (Sec.)
 Y (Row.)
 X (Col.)


-Supplemental data
-Mask #1
| File | emd_10326_msk_1.map | ||||||||||||
|---|---|---|---|---|---|---|---|---|---|---|---|---|---|
| Projections & Slices |
| ||||||||||||
| Density Histograms |


-Additional map: Multibody refinement of Gid2 9
| File | emd_10326_additional.map | ||||||||||||
|---|---|---|---|---|---|---|---|---|---|---|---|---|---|
| Annotation | Multibody refinement of Gid2_9 | ||||||||||||
| Projections & Slices |
| ||||||||||||
| Density Histograms |


-Additional map: Multibody refinement of Gid2 9
| File | emd_10326_additional_1.map | ||||||||||||
|---|---|---|---|---|---|---|---|---|---|---|---|---|---|
| Annotation | Multibody refinement of Gid2_9 | ||||||||||||
| Projections & Slices |
| ||||||||||||
| Density Histograms |


-Half map: #2
| File | emd_10326_half_map_1.map | ||||||||||||
|---|---|---|---|---|---|---|---|---|---|---|---|---|---|
| Projections & Slices |
| ||||||||||||
| Density Histograms |


-Half map: #1
| File | emd_10326_half_map_2.map | ||||||||||||
|---|---|---|---|---|---|---|---|---|---|---|---|---|---|
| Projections & Slices |
| ||||||||||||
| Density Histograms |


- Sample components
-Entire : GIDAnt
| Entire | Name: GIDAnt |
|---|---|
| Components |
|
-Supramolecule #1: GIDAnt
| Supramolecule | Name: GIDAnt / type: complex / ID: 1 / Parent: 0 |
|---|---|
| Source (natural) | Organism: |
| Recombinant expression | Organism:  Spodoptera aff. frugiperda 1 BOLD-2017 (butterflies/moths) Spodoptera aff. frugiperda 1 BOLD-2017 (butterflies/moths) |
| Molecular weight | Theoretical: 374.44 KDa |
-Experimental details
-Structure determination
| Method | cryo EM |
|---|---|
 Processing Processing | single particle reconstruction |
| Aggregation state | particle |
-Sample preparation
| Concentration | 0.25 mg/mL | ||||||||||||
|---|---|---|---|---|---|---|---|---|---|---|---|---|---|
| Buffer | pH: 6.5 Component:
| ||||||||||||
| Grid | Model: Quantifoil R1.2/1.3 / Material: COPPER / Mesh: 200 / Pretreatment - Type: GLOW DISCHARGE / Pretreatment - Atmosphere: AIR | ||||||||||||
| Vitrification | Cryogen name: ETHANE / Chamber humidity: 100 % / Chamber temperature: 277.15 K / Instrument: FEI VITROBOT MARK IV / Details: 10s and 10 f blot after 30s incubation time. |
- Electron microscopy
| Microscope | FEI TITAN KRIOS |
|---|---|
| Image recording | Film or detector model: GATAN K2 SUMMIT (4k x 4k) / Detector mode: COUNTING / Average exposure time: 7.0 sec. / Average electron dose: 55.16 e/Å2 |
| Electron beam | Acceleration voltage: 300 kV / Electron source:  FIELD EMISSION GUN FIELD EMISSION GUN |
| Electron optics | Illumination mode: FLOOD BEAM / Imaging mode: BRIGHT FIELD |
| Experimental equipment |  Model: Titan Krios / Image courtesy: FEI Company |

