 Movie
Movie Controller

[English] 日本語
 Yorodumi
- EMDB-7037: Cryo-EM structure of the dimeric FO region of yeast mitochondrial... -
+ Open data

- Basic information
| Entry | Database: EMDB / ID: EMD-7037 | |||||||||
|---|---|---|---|---|---|---|---|---|---|---|
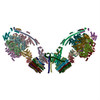
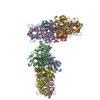
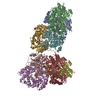
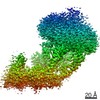
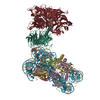
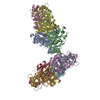
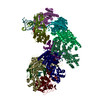
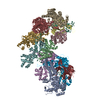
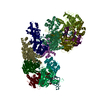
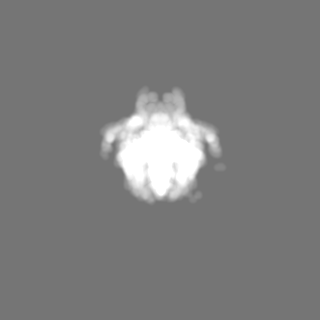
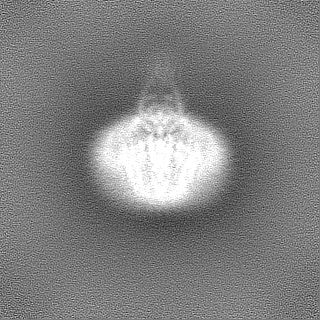
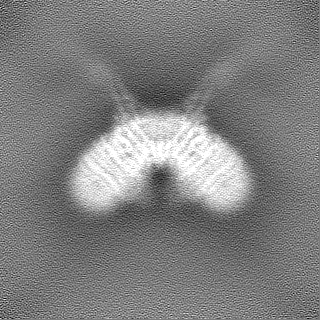
| Title | Cryo-EM structure of the dimeric FO region of yeast mitochondrial ATP synthase with C1 symmetry | |||||||||
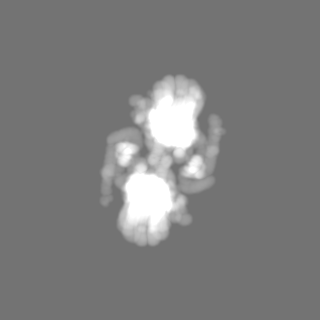
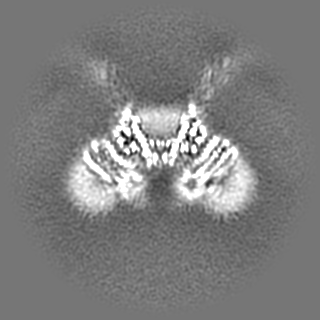
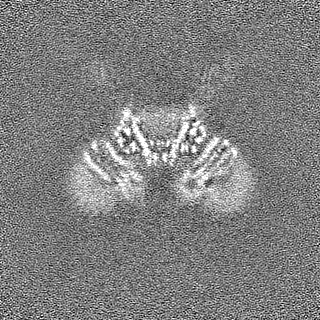
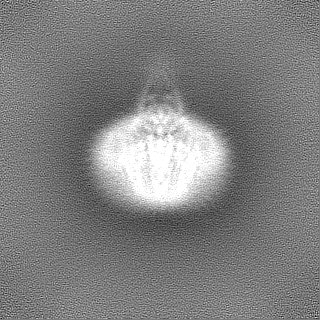
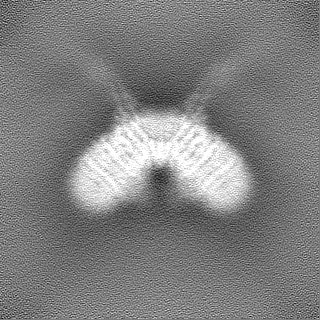
 Map data Map data | Sharpened map of dimeric FO region of yeast mitochondrial ATP synthase | |||||||||
 Sample Sample |
| |||||||||
| Biological species |  | |||||||||
| Method | single particle reconstruction / cryo EM / Resolution: 3.7 Å | |||||||||
 Authors Authors | Guo H / Rubinstein JL | |||||||||
 Citation Citation | Journal: Science / Year: 2017 Title: Atomic model for the dimeric F region of mitochondrial ATP synthase. Authors: Hui Guo / Stephanie A Bueler / John L Rubinstein /  Abstract: Mitochondrial adenosine triphosphate (ATP) synthase produces the majority of ATP in eukaryotic cells, and its dimerization is necessary to create the inner membrane folds, or cristae, characteristic ...Mitochondrial adenosine triphosphate (ATP) synthase produces the majority of ATP in eukaryotic cells, and its dimerization is necessary to create the inner membrane folds, or cristae, characteristic of mitochondria. Proton translocation through the membrane-embedded F region turns the rotor that drives ATP synthesis in the soluble F region. Although crystal structures of the F region have illustrated how this rotation leads to ATP synthesis, understanding how proton translocation produces the rotation has been impeded by the lack of an experimental atomic model for the F region. Using cryo-electron microscopy, we determined the structure of the dimeric F complex from at a resolution of 3.6 angstroms. The structure clarifies how the protons travel through the complex, how the complex dimerizes, and how the dimers bend the membrane to produce cristae. | |||||||||
| History |
|
- Structure visualization
| Movie |
 Movie viewer Movie viewer |
|---|---|
| Structure viewer | EM map: SurfViewMolmilJmol/JSmol |
| Supplemental images |

- Downloads & links
-EMDB archive
| Map data | emd_7037.map.gz | 117.5 MB | EMDB map data format | |
|---|---|---|---|---|
| Header (meta data) | emd-7037-v30.xmlemd-7037.xml | 20.1 KB 20.1 KB | Display Display | EMDB header |
| Images | 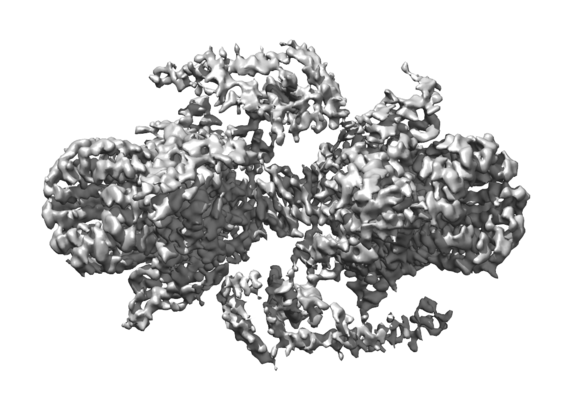 emd_7037.png emd_7037.png | 119.3 KB | ||
| Masks | emd_7037_msk_1.map | 125 MB | Mask map | |
| Others | emd_7037_additional.map.gzemd_7037_half_map_1.map.gzemd_7037_half_map_2.map.gz | 62.3 MB 115.9 MB 115.9 MB | ||
| Archive directory |  http://ftp.pdbj.org/pub/emdb/structures/EMD-7037ftp://ftp.pdbj.org/pub/emdb/structures/EMD-7037 http://ftp.pdbj.org/pub/emdb/structures/EMD-7037ftp://ftp.pdbj.org/pub/emdb/structures/EMD-7037 | HTTPS FTP |
-Related structure data

-Links
| EMDB pages | EMDB (EBI/PDBe) / EMDataResource |
|---|
-Map
| File | Download / File: emd_7037.map.gz / Format: CCP4 / Size: 125 MB / Type: IMAGE STORED AS FLOATING POINT NUMBER (4 BYTES) | ||||||||||||||||||||||||||||||||||||||||||||||||||||||||||||
|---|---|---|---|---|---|---|---|---|---|---|---|---|---|---|---|---|---|---|---|---|---|---|---|---|---|---|---|---|---|---|---|---|---|---|---|---|---|---|---|---|---|---|---|---|---|---|---|---|---|---|---|---|---|---|---|---|---|---|---|---|---|
| Annotation | Sharpened map of dimeric FO region of yeast mitochondrial ATP synthase | ||||||||||||||||||||||||||||||||||||||||||||||||||||||||||||
| Projections & slices | Image control
Images are generated by Spider. | ||||||||||||||||||||||||||||||||||||||||||||||||||||||||||||
| Voxel size | X=Y=Z: 1.06 Å | ||||||||||||||||||||||||||||||||||||||||||||||||||||||||||||
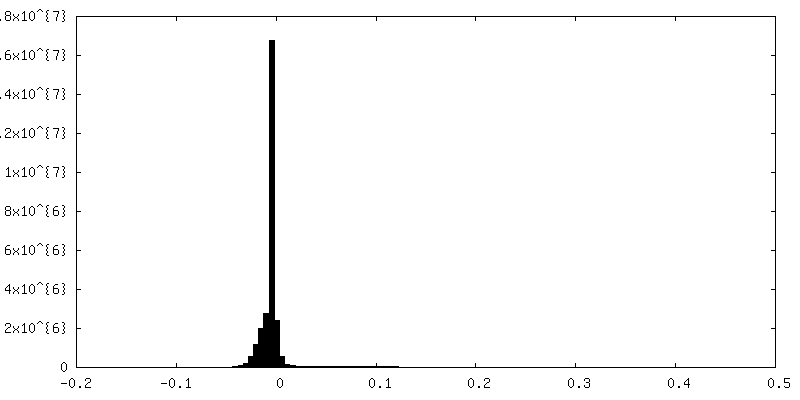
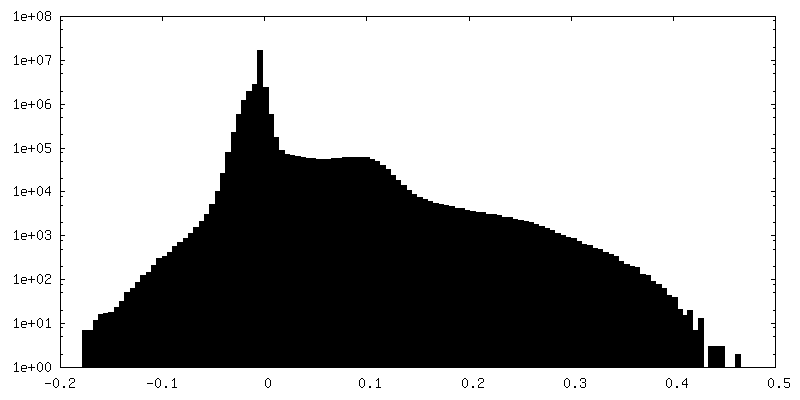
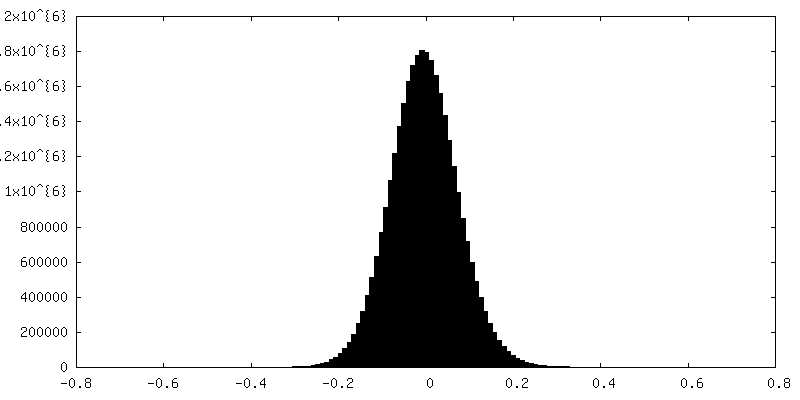
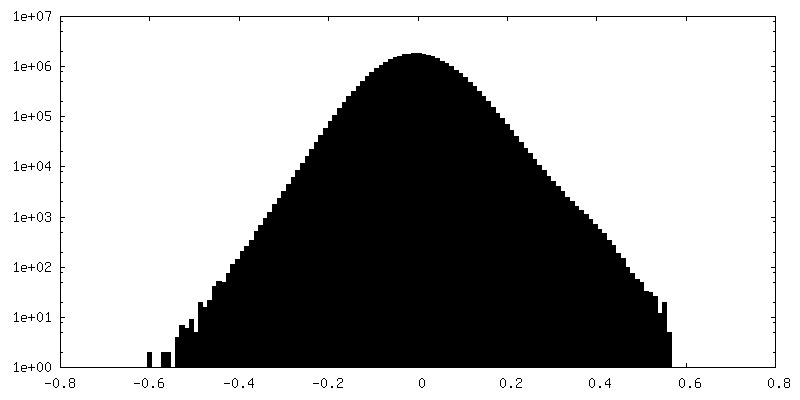
| Density |
| ||||||||||||||||||||||||||||||||||||||||||||||||||||||||||||
| Symmetry | Space group: 1 | ||||||||||||||||||||||||||||||||||||||||||||||||||||||||||||
| Details | EMDB XML:
CCP4 map header:
| ||||||||||||||||||||||||||||||||||||||||||||||||||||||||||||
 Z (Sec.)
 Y (Row.)
 X (Col.)


-Supplemental data
-Mask #1
| File | emd_7037_msk_1.map | ||||||||||||
|---|---|---|---|---|---|---|---|---|---|---|---|---|---|
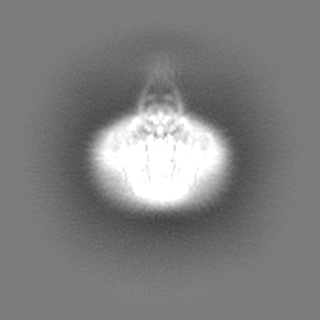
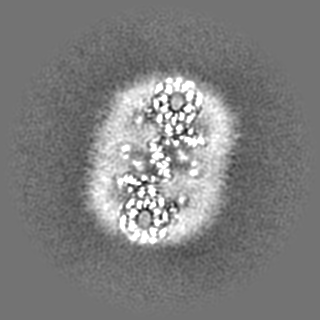
| Projections & Slices |
| ||||||||||||
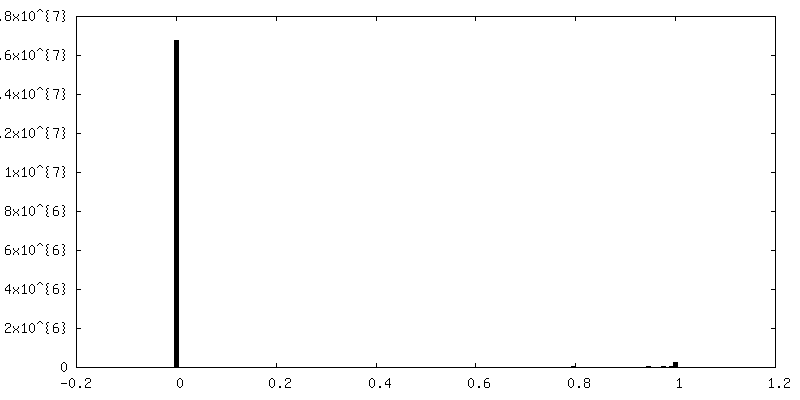
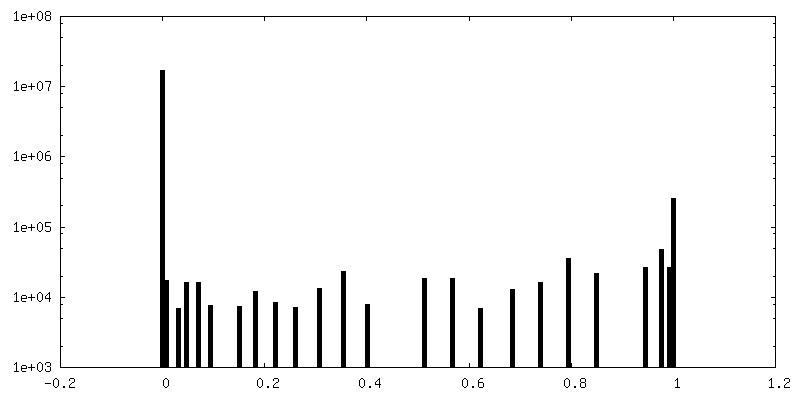
| Density Histograms |

-Additional map: Unsharpened map of dimeric FO region of yeast...
| File | emd_7037_additional.map | ||||||||||||
|---|---|---|---|---|---|---|---|---|---|---|---|---|---|
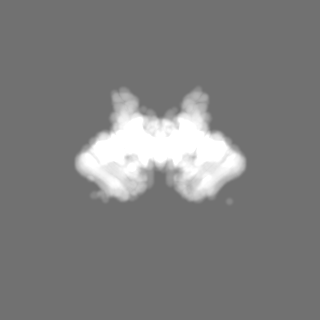
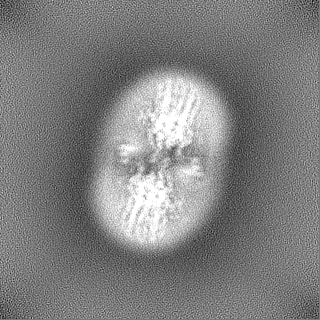
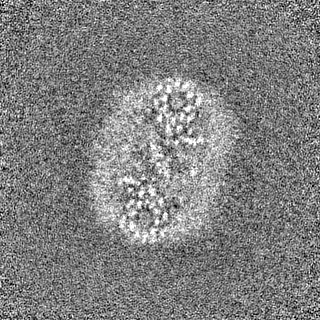
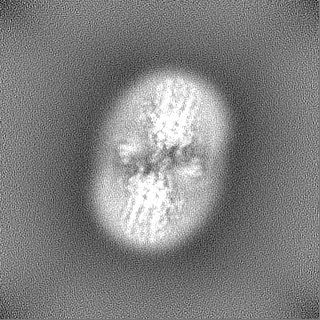
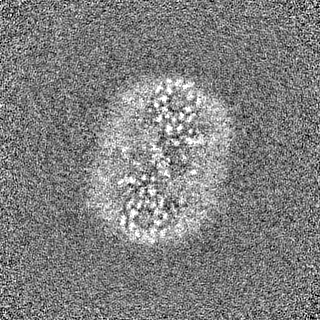
| Annotation | Unsharpened map of dimeric FO region of yeast mitochondrial ATP synthase | ||||||||||||
| Projections & Slices |
| ||||||||||||
| Density Histograms |


-Half map: Dimeric FO region of yeast mitochondrial ATP synthase, half map-1
| File | emd_7037_half_map_1.map | ||||||||||||
|---|---|---|---|---|---|---|---|---|---|---|---|---|---|
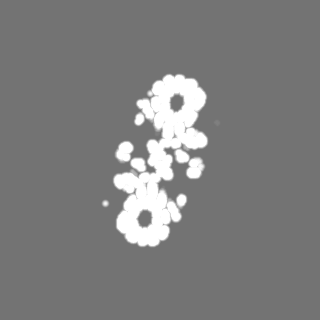
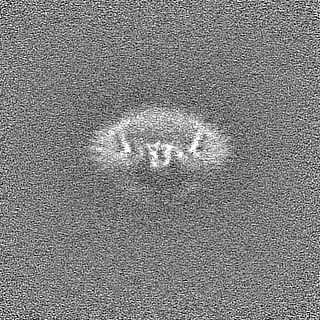
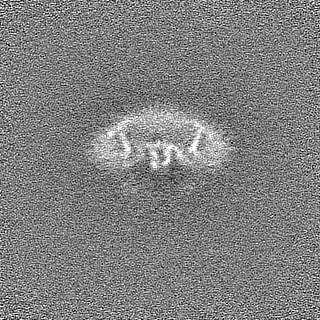
| Annotation | Dimeric FO region of yeast mitochondrial ATP synthase, half map-1 | ||||||||||||
| Projections & Slices |
| ||||||||||||
| Density Histograms |
-Half map: Dimeric FO region of yeast mitochondrial ATP synthase, half map-2
| File | emd_7037_half_map_2.map | ||||||||||||
|---|---|---|---|---|---|---|---|---|---|---|---|---|---|
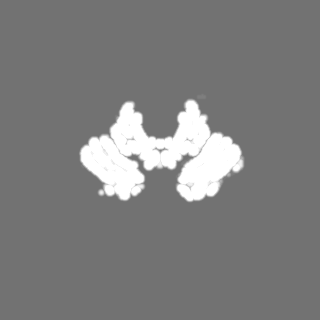
| Annotation | Dimeric FO region of yeast mitochondrial ATP synthase, half map-2 | ||||||||||||
| Projections & Slices |
| ||||||||||||
| Density Histograms |


- Sample components
-Entire : Yeast mitochondrial ATP synthase FO complex
| Entire | Name: Yeast mitochondrial ATP synthase FO complex |
|---|---|
| Components |
|
-Supramolecule #1: Yeast mitochondrial ATP synthase FO complex
| Supramolecule | Name: Yeast mitochondrial ATP synthase FO complex / type: complex / ID: 1 / Parent: 0 / Macromolecule list: #1-#10 |
|---|---|
| Source (natural) | Organism: |
| Molecular weight | Theoretical: 400 KDa |
-Experimental details
-Structure determination
| Method | cryo EM |
|---|---|
 Processing Processing | single particle reconstruction |
| Aggregation state | particle |
-Sample preparation
| Concentration | 5 mg/mL |
|---|---|
| Buffer | pH: 7.4 |
| Grid | Model: Homemade / Material: COPPER/RHODIUM / Pretreatment - Type: GLOW DISCHARGE / Pretreatment - Atmosphere: AIR |
| Vitrification | Cryogen name: ETHANE-PROPANE / Chamber humidity: 100 % / Chamber temperature: 277 K / Details: blot for 26 seconds before plunging. |
- Electron microscopy
| Microscope | FEI TITAN KRIOS |
|---|---|
| Specialist optics | Energy filter - Lower energy threshold: 0 eV / Energy filter - Upper energy threshold: 20 eV |
| Image recording | Film or detector model: GATAN K2 QUANTUM (4k x 4k) / Detector mode: COUNTING / Digitization - Dimensions - Width: 3710 pixel / Digitization - Dimensions - Height: 3838 pixel / Digitization - Frames/image: 1-50 / Number grids imaged: 2 / Number real images: 3023 / Average exposure time: 10.0 sec. / Average electron dose: 71.0 e/Å2 |
| Electron beam | Acceleration voltage: 300 kV / Electron source:  FIELD EMISSION GUN FIELD EMISSION GUN |
| Electron optics | Calibrated defocus max: 3.5 µm / Calibrated defocus min: 0.5 µm / Calibrated magnification: 47170 / Illumination mode: FLOOD BEAM / Imaging mode: BRIGHT FIELD / Cs: 2.7 mm / Nominal defocus max: 2.0 µm / Nominal defocus min: 1.0 µm / Nominal magnification: 130000 |
| Sample stage | Specimen holder model: FEI TITAN KRIOS AUTOGRID HOLDER / Cooling holder cryogen: NITROGEN |
| Experimental equipment |  Model: Titan Krios / Image courtesy: FEI Company |
+Image processing
-Atomic model buiding 1
| Refinement | Protocol: AB INITIO MODEL |
|---|
