 Movie
Movie Controller


+ Open data

- Basic information
| Entry | Database: PDB / ID: 5uu5 | ||||||
|---|---|---|---|---|---|---|---|
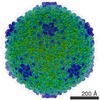
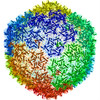
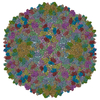
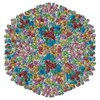
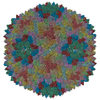
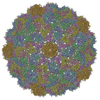
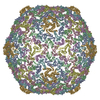
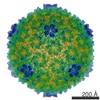
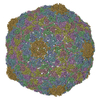
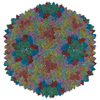
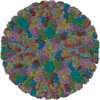
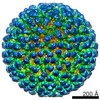
| Title | Bacteriophage P22 mature virion capsid protein | ||||||
 Components Components | Major capsid protein | ||||||
 Keywords Keywords | VIRUS / P22 Bacteriophage | ||||||
| Function / homology | Major capsid protein Gp5 / P22 coat protein - gene protein 5 / viral procapsid / viral procapsid maturation / T=7 icosahedral viral capsid / viral capsid / identical protein binding / Major capsid protein Function and homology information Function and homology information | ||||||
| Biological species |  Salmonella phage P22 (virus) Salmonella phage P22 (virus) | ||||||
| Method | ELECTRON MICROSCOPY / single particle reconstruction / cryo EM / Resolution: 3.3 Å | ||||||
 Authors Authors | Hryc, C.F. / Chen, D.-H. / Afonine, P.V. / Jakana, J. / Wang, Z. / Haase-Pettingell, C. / Jiang, W. / Adams, P.D. / King, J.A. / Schmid, M.F. / Chiu, W. | ||||||
 Citation Citation | Journal: Proc Natl Acad Sci U S A / Year: 2017 Title: Accurate model annotation of a near-atomic resolution cryo-EM map. Authors: Corey F Hryc / Dong-Hua Chen / Pavel V Afonine / Joanita Jakana / Zhao Wang / Cameron Haase-Pettingell / Wen Jiang / Paul D Adams / Jonathan A King / Michael F Schmid / Wah Chiu /  Abstract: Electron cryomicroscopy (cryo-EM) has been used to determine the atomic coordinates (models) from density maps of biological assemblies. These models can be assessed by their overall fit to the ...Electron cryomicroscopy (cryo-EM) has been used to determine the atomic coordinates (models) from density maps of biological assemblies. These models can be assessed by their overall fit to the experimental data and stereochemical information. However, these models do not annotate the actual density values of the atoms nor their positional uncertainty. Here, we introduce a computational procedure to derive an atomic model from a cryo-EM map with annotated metadata. The accuracy of such a model is validated by a faithful replication of the experimental cryo-EM map computed using the coordinates and associated metadata. The functional interpretation of any structural features in the model and its utilization for future studies can be made in the context of its measure of uncertainty. We applied this protocol to the 3.3-Å map of the mature P22 bacteriophage capsid, a large and complex macromolecular assembly. With this protocol, we identify and annotate previously undescribed molecular interactions between capsid subunits that are crucial to maintain stability in the absence of cementing proteins or cross-linking, as occur in other bacteriophages. | ||||||
| History |
|
- Structure visualization
| Movie |
Movie viewer |
|---|---|
| Structure viewer | Molecule: MolmilJmol/JSmol |
- Downloads & links
-Download
| PDBx/mmCIF format | 5uu5.cif.gz | 560 KB | Display | PDBx/mmCIF format |
|---|---|---|---|---|
| PDB format | pdb5uu5.ent.gz | 468.5 KB | Display | PDB format |
| PDBx/mmJSON format | 5uu5.json.gz | Tree view | PDBx/mmJSON format | |
| Others |  Other downloads Other downloads |
-Validation report
| Arichive directory | https://data.pdbj.org/pub/pdb/validation_reports/uu/5uu5ftp://data.pdbj.org/pub/pdb/validation_reports/uu/5uu5 | HTTPS FTP |
|---|
-Related structure data
| Related structure data | 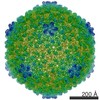 8606MC M: map data used to model this data C: citing same article ( |
|---|---|
| Similar structure data | |
| EM raw data | EMPIAR-10083 (Title: Bacteriophage P22 mature virion capsid protein / Data size: 159.4 Data #1: Corrected images of P22 Mature Phage [picked particles - multiframe - processed]) |
-Links
 PDBj
PDBj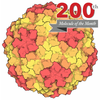
- Assembly
| Deposited unit | 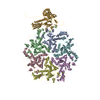
|
|---|---|
| 1 | x 60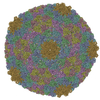
|
| 2 |
|
| 3 | x 5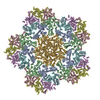
|
| 4 | x 6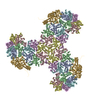
|
| 5 | 
|
| Symmetry | Point symmetry: (Schoenflies symbol: I (icosahedral)) |
-Components
| #1: Protein | Mass: 46795.613 Da / Num. of mol.: 7 Source method: isolated from a genetically manipulated source Source: (gene. exp.) Salmonella phage P22 (virus)Production host:  Salmonella enterica subsp. enterica serovar Typhimurium (bacteria) Salmonella enterica subsp. enterica serovar Typhimurium (bacteria)References: UniProt: P26747 |
|---|
-Experimental details
-Experiment
| Experiment | Method: ELECTRON MICROSCOPY |
|---|---|
| EM experiment | Aggregation state: PARTICLE / 3D reconstruction method: single particle reconstruction |
- Sample preparation
| Component | Name: Enterobacteria phage P22 / Type: VIRUS / Entity ID: all / Source: RECOMBINANT |
|---|---|
| Molecular weight | Value: 327.57294 MDa / Experimental value: NO |
| Source (natural) | Organism: Enterobacteria phage P22 (virus) |
| Source (recombinant) | Organism: Salmonella enterica subsp. enterica serovar Typhimurium (bacteria) |
| Details of virus | Empty: NO / Enveloped: NO / Isolate: SPECIES / Type: VIRION |
| Virus shell | Name: Capsid / Diameter: 735 nm / Triangulation number (T number): 7 |
| Buffer solution | pH: 7.6 / Details: 50 mM Tris, pH 7.6, 1 mM MgCl2, 25 mM NaCl |
| Specimen | Conc.: 1 mg/ml / Embedding applied: NO / Shadowing applied: NO / Staining applied: NO / Vitrification applied: YES |
| Specimen support | Grid material: COPPER / Grid mesh size: 400 divisions/in. / Grid type: Quantifoil |
| Vitrification | Instrument: FEI VITROBOT MARK IV / Cryogen name: ETHANE / Humidity: 100 % / Chamber temperature: 298 K / Details: single blot, one second duration |
- Electron microscopy imaging
| Microscopy | Model: JEOL 3200FSC / Details: normal alignment |
|---|---|
| Electron gun | Electron source:  FIELD EMISSION GUN / Accelerating voltage: 300 kV / Illumination mode: FLOOD BEAM FIELD EMISSION GUN / Accelerating voltage: 300 kV / Illumination mode: FLOOD BEAM |
| Electron lens | Mode: BRIGHT FIELD / Nominal magnification: 50000 X / Nominal defocus max: 3500 nm / Nominal defocus min: 1500 nm / Cs: 2.7 mm / C2 aperture diameter: 100 µm / Alignment procedure: COMA FREE |
| Specimen holder | Cryogen: NITROGEN / Specimen holder model: JEOL 3200FSC CRYOHOLDER / Temperature (max): 87 K / Temperature (min): 86 K |
| Image recording | Average exposure time: 1.5 sec. / Electron dose: 37.5 e/Å2 / Detector mode: INTEGRATING / Film or detector model: DIRECT ELECTRON DE-20 (5k x 3k) / Num. of grids imaged: 1 / Num. of real images: 2927 |
| EM imaging optics | Energyfilter name: In-column Omega Filter / Energyfilter upper: 20 eV / Energyfilter lower: 0 eV / Chromatic aberration corrector: none / Spherical aberration corrector: none |
| Image scans | Sampling size: 6.4 µm / Width: 5120 / Height: 3840 / Movie frames/image: 24 / Used frames/image: 1-6 |
- Processing
| EM software |
| |||||||||||||||||||||||||||||||||||||||||||||
|---|---|---|---|---|---|---|---|---|---|---|---|---|---|---|---|---|---|---|---|---|---|---|---|---|---|---|---|---|---|---|---|---|---|---|---|---|---|---|---|---|---|---|---|---|---|---|
| Image processing | Details: Movie-mode data was drift-corrected and damage-compensated using the program DE_process_frames.py. | |||||||||||||||||||||||||||||||||||||||||||||
| CTF correction | Details: Per frame or incoherent sum of particle images, using CTFfind3 Type: PHASE FLIPPING AND AMPLITUDE CORRECTION | |||||||||||||||||||||||||||||||||||||||||||||
| Particle selection | Num. of particles selected: 57292 Details: Automatic particle selection was followed by manual screening to remove bad particles and junk. | |||||||||||||||||||||||||||||||||||||||||||||
| Symmetry | Point symmetry: I (icosahedral) | |||||||||||||||||||||||||||||||||||||||||||||
| 3D reconstruction | Resolution: 3.3 Å / Resolution method: FSC 0.143 CUT-OFF / Num. of particles: 45150 Details: All the selected 45,150 particle images were first shrunk by a factor of four to a box size of 216x216 in order to accelerate the data processing at low resolutions. About 2,100 shrunken ...Details: All the selected 45,150 particle images were first shrunk by a factor of four to a box size of 216x216 in order to accelerate the data processing at low resolutions. About 2,100 shrunken particle images with largest defocuses were selected from each subset to build the initial template, again using the program JSPR. Five sets of 300 particle images were randomly selected from the highly-defocused 2,100 particle images of each subset, then the global orientation search was performed using JSPR for 20 iterations. The maps from each set were visually examined, and one of the converged maps was selected from the last iterations of each subset. This map was then used as the initial template for the global orientation search for all four-times-shrunken particle images. Several global orientation searches were carried out for the four-times-shrunken data until the resolution converged, as judged by the Fourier Shell Correlation (FSC) curve of two independent data sets (the best 11,000 particles of each). The subsequent local orientation determination was performed using data up to a resolution slightly lower than the resolution assessed by the Gold Standard FSC = 0.143 criterion from the previous iteration, until resolution experienced no further improvement. The orientations and centers for the four-times-shrunken data were then migrated to the full-size (864x864) particle images for additional orientation determination. It should be noted the first frame was removed from all images and that orientation determination was done with all 23 remaining frames. We then experimented with different sets of subframes of the same particle data set and assessed the density connectivity and resolvability within these different maps. Once this was complete, we found empirically that using frames 1 through 6 (dose of ~10 e/A2), with both motion and damage corrections, yielded the best resolved density map, with a resolution of 3.3 Angstrom based on the Gold Standard estimate. The final reconstruction was produced from the best ~50% of the total particle images. The amplitude of all cryoEM density maps for visualization was scaled to the X-ray structure of bacteriophage HK97 mature capsid (PDB ID: 1OHG) and low-pass filtered to ~3.0 Angstrom resolution. Symmetry type: POINT | |||||||||||||||||||||||||||||||||||||||||||||
| Atomic model building | B value: 0.836 / Protocol: AB INITIO MODEL / Space: REAL Details: In order to generate the atomic model, we fit our old model (PDB ID: 2XYZ) into subunit A, specifically the hexon capsid protein that sits at the two-fold axis with the penton subunit. To ...Details: In order to generate the atomic model, we fit our old model (PDB ID: 2XYZ) into subunit A, specifically the hexon capsid protein that sits at the two-fold axis with the penton subunit. To segment the capsid protein, a 30 Angstrom color zone in Chimera was used to separate the density. This ensured that any alteration in protein fold between the previous and current models would not be missed during the segmentation process. The segmented map was then imported into Coot and amino acid PRO25 was easily identified with a kink, similar to where it was previously located. This residue is located at the end of the N-arm and is predicted to be in a small helix which can be identified in the map. From there, baton building was done to the C-terminus and back to the N-terminus, completing the N-arm. Once complete, amino acids were mutated computationally one at a time and registration errors were adjusted based on visible density. All aromatic amino acids were visible and were used as anchor points for other amino acids that lacked strong positive density, such as negatively charged residues. The model was then optimized using the density as a constraint using Phenix.real_space_refine with default parameters, plus simulated annealing to encourage fit to density. Coot was then used to adjust various regions of the model that did not converge into the density such as a portion of the N-arm (weak density) and D-loop (containing several negatively charged amino acids with weak side-chain density). Real-space model optimization again followed, this time without simulated annealing. This model has two domains, the insertion domain and the P-domain / N-arm, that were interpreted differently in a previous model derived from a lower resolution map. We expected that improved resolution would alter the protein fold in the insertion domain. However, we did not anticipate any alterations in other regions of the model. When assessing the P-domain, we noted improved connectivity of the B-sheets in addition to a fourth strand which was previously modeled wrongly as the N-terminal helix due to poor resolvability. This fourth strand has never been seen in capsid proteins of the bacteriophage, and thus modeling it differently was understandable. When adjusting the threshold, a strand of density extending to the neighboring two-fold axis became visible from the PRO25 anchor point. The resulting model was placed into the density of the other six subunits in an asymmetric unit (ASU), and loops with large variations (the E-loop and a loop in the A-domain) were adjusted manually using Coot. Again, real-space model optimization of the complex followed using default parameters. The refined ASU was then surrounded by neighboring asymmetric units, ensuring that clashes would be avoided and interactions optimized. Coot was then used to manually adjust any rotamers or regions with poor geometry. Moreover, Phenix.molprobity was run to generate a Coot import file, allowing for the removal of extreme clashes and Ramachandran outliers. Finally, a second round of real-space model optimization was completed with simulated annealing and morphing applied. This allowed for greater freedom of model movement. A final MolProbity check was completed to assess stereochemistry. To assess fit to density, cross-correlation was computed during phenix.real_space_refine, and an EMRinger was computed. Model to Calculated Map: To generate a weighted map from the model that would represent the experimental density map, both occupancies and ADPs had to be refined against the experimental map. ADPs were first set to 50 (Angstrom)^2 for all amino acids in our ASU - with surrounding subunits - and refined with phenix.real_space_refine (run=adp). Two iterations were performed to insure convergence. Occupancies were then changed to -0.5 for all carboxyl oxygens in the refined complex. This negative value was needed in order to produce negative density in the map calculated from the model. These occupancies do not refer to the absence of atoms, but rather are used as weighting values due to the lack of a proper form factor. Occupancies were then refined with phenix.refine in reciprocal space, which resulted in some occupancies reverting to positivevalues. An additional iteration of ADP and occupancy refinement then followed. With atom positions, ADPs, and occupancies all refined, a map was calculated from the model at 3.3 Angstrom resolution using Phenix.fmodel and converted to a CCP4 format map using phenix.mtz2map. Model Validation / Uncertainty: The generation of two independent models optimized for the two half maps is a validation practice which assures that agreement is consistent with the claimed 3.3 Angstrom resolution as reflected by the FSC=0.5 numerical value suggested previously. Moreover, assessment of independent models provides an understanding of the level of uncertainty within the map. Both half data sets (~3.4 Angstrom resolution) were modeled independently. Model variation to assess uncertainty was computed in Chimera, and the FSC was computed with EMAN2. |
