 Movie
Movie Controller


+ Open data

- Basic information
| Entry |  | |||||||||
|---|---|---|---|---|---|---|---|---|---|---|
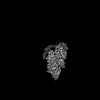
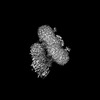
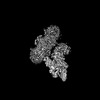
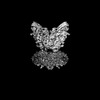
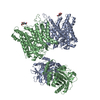
| Title | Cytoplasmic domain of ankyrin complex (B2P1A1) | |||||||||
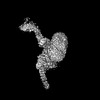
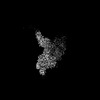
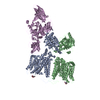
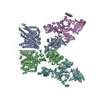
 Map data Map data | Cytoplasmic domain of Ankyrin complex (B2P1A1) | |||||||||
 Sample Sample |
| |||||||||
 Keywords Keywords | Red blood cell / Ankyrin complex / membrane protein / band 3 / protein 4.2 | |||||||||
| Biological species |  Homo sapiens (human) Homo sapiens (human) | |||||||||
| Method | single particle reconstruction / cryo EM / Resolution: 4.1 Å | |||||||||
 Authors Authors | Xia X / Liu SH / Zhou ZH | |||||||||
| Funding support |  United States, 1 items United States, 1 items
| |||||||||
 Citation Citation | Journal: Nat Struct Mol Biol / Year: 2022 Title: Structure, dynamics and assembly of the ankyrin complex on human red blood cell membrane. Authors: Xian Xia / Shiheng Liu / Z Hong Zhou / Abstract: The cytoskeleton of a red blood cell (RBC) is anchored to the cell membrane by the ankyrin complex. This complex is assembled during RBC genesis and comprises primarily band 3, protein 4.2 and ...The cytoskeleton of a red blood cell (RBC) is anchored to the cell membrane by the ankyrin complex. This complex is assembled during RBC genesis and comprises primarily band 3, protein 4.2 and ankyrin, whose mutations contribute to numerous human inherited diseases. High-resolution structures of the ankyrin complex have been long sought-after to understand its assembly and disease-causing mutations. Here, we analyzed native complexes on the human RBC membrane by stepwise fractionation. Cryo-electron microscopy structures of nine band-3-associated complexes reveal that protein 4.2 stabilizes the cytoplasmic domain of band 3 dimer. In turn, the superhelix-shaped ankyrin binds to this protein 4.2 via ankyrin repeats (ARs) 6-13 and to another band 3 dimer via ARs 17-20, bridging two band 3 dimers in the ankyrin complex. Integration of these structures with both prior data and our biochemical data supports a model of ankyrin complex assembly during erythropoiesis and identifies interactions essential for the mechanical stability of RBC. | |||||||||
| History |
|
- Structure visualization
| Supplemental images |
|---|

- Downloads & links
-EMDB archive
| Map data | emd_26150.map.gz | 203.8 MB |  EMDB map data format EMDB map data format | |
|---|---|---|---|---|
| Header (meta data) | emd-26150-v30.xmlemd-26150.xml | 12.4 KB 12.4 KB | Display Display | EMDB header |
| Images | 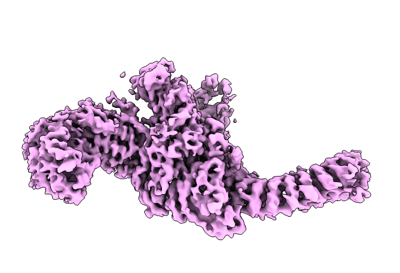 emd_26150.png emd_26150.png | 76.1 KB | ||
| Filedesc metadata | emd-26150.cif.gz | 4.1 KB | ||
| Archive directory |  http://ftp.pdbj.org/pub/emdb/structures/EMD-26150ftp://ftp.pdbj.org/pub/emdb/structures/EMD-26150 http://ftp.pdbj.org/pub/emdb/structures/EMD-26150ftp://ftp.pdbj.org/pub/emdb/structures/EMD-26150 | HTTPS FTP |
-Validation report
| Summary document | emd_26150_validation.pdf.gz | 492.3 KB | Display | EMDB validaton report |
|---|---|---|---|---|
| Full document | emd_26150_full_validation.pdf.gz | 491.8 KB | Display | |
| Data in XML | emd_26150_validation.xml.gz | 7.1 KB | Display | |
| Data in CIF | emd_26150_validation.cif.gz | 8.1 KB | Display | |
| Arichive directory | https://ftp.pdbj.org/pub/emdb/validation_reports/EMD-26150ftp://ftp.pdbj.org/pub/emdb/validation_reports/EMD-26150 | HTTPS FTP |
-Related structure data


-Links
| EMDB pages | EMDB (EBI/PDBe) / EMDataResource |
|---|
-Map
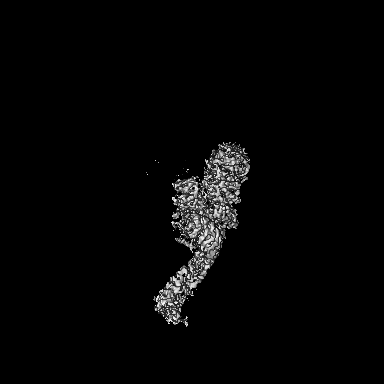
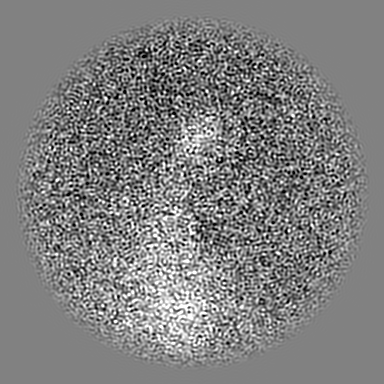
| File | Download / File: emd_26150.map.gz / Format: CCP4 / Size: 216 MB / Type: IMAGE STORED AS FLOATING POINT NUMBER (4 BYTES) | ||||||||||||||||||||||||||||||||||||
|---|---|---|---|---|---|---|---|---|---|---|---|---|---|---|---|---|---|---|---|---|---|---|---|---|---|---|---|---|---|---|---|---|---|---|---|---|---|
| Annotation | Cytoplasmic domain of Ankyrin complex (B2P1A1) | ||||||||||||||||||||||||||||||||||||
| Projections & slices | Image control
Images are generated by Spider. | ||||||||||||||||||||||||||||||||||||
| Voxel size | X=Y=Z: 1.1 Å | ||||||||||||||||||||||||||||||||||||
| Density |
| ||||||||||||||||||||||||||||||||||||
| Symmetry | Space group: 1 | ||||||||||||||||||||||||||||||||||||
| Details | EMDB XML:
|
 Z (Sec.)
 Y (Row.)
 X (Col.)


-Supplemental data
- Sample components
-Entire : High-salt fraction 2 from human red blood cell membrane
| Entire | Name: High-salt fraction 2 from human red blood cell membrane |
|---|---|
| Components |
|
-Supramolecule #1: High-salt fraction 2 from human red blood cell membrane
| Supramolecule | Name: High-salt fraction 2 from human red blood cell membrane type: complex / ID: 1 / Parent: 0 / Macromolecule list: #1-#4 |
|---|---|
| Source (natural) | Organism: Homo sapiens (human) |
| Molecular weight | Theoretical: 480 KDa |
-Experimental details
-Structure determination
| Method | cryo EM |
|---|---|
 Processing Processing | single particle reconstruction |
| Aggregation state | particle |
-Sample preparation
| Concentration | 2.5 mg/mL | |||||||||||||||
|---|---|---|---|---|---|---|---|---|---|---|---|---|---|---|---|---|
| Buffer | pH: 7.5 Component:
| |||||||||||||||
| Grid | Model: UltrAuFoil R1.2/1.3 / Material: GOLD / Mesh: 300 / Support film - Material: GOLD / Support film - topology: HOLEY | |||||||||||||||
| Vitrification | Cryogen name: ETHANE / Chamber humidity: 100 % / Instrument: FEI VITROBOT MARK IV |
- Electron microscopy
| Microscope | FEI TITAN KRIOS |
|---|---|
| Temperature | Min: 100.0 K / Max: 100.0 K |
| Image recording | Film or detector model: GATAN K3 BIOQUANTUM (6k x 4k) / Number grids imaged: 1 / Number real images: 21187 / Average exposure time: 2.0 sec. / Average electron dose: 50.0 e/Å2 |
| Electron beam | Acceleration voltage: 300 kV / Electron source:  FIELD EMISSION GUN FIELD EMISSION GUN |
| Electron optics | C2 aperture diameter: 50.0 µm / Illumination mode: FLOOD BEAM / Imaging mode: BRIGHT FIELD / Cs: 2.7 mm / Nominal defocus max: 3.5 µm / Nominal defocus min: 1.8 µm / Nominal magnification: 81000 |
| Sample stage | Specimen holder model: FEI TITAN KRIOS AUTOGRID HOLDER / Cooling holder cryogen: NITROGEN |
| Experimental equipment |  Model: Titan Krios / Image courtesy: FEI Company |
+Image processing
-Atomic model buiding 1
| Refinement | Space: REAL / Protocol: AB INITIO MODEL / Overall B value: 155 |
|---|
