 Movie
Movie Controller


+ Open data

- Basic information
| Entry | Database: EMDB / ID: EMD-6244 | |||||||||
|---|---|---|---|---|---|---|---|---|---|---|
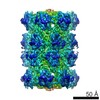
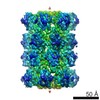
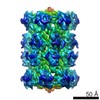
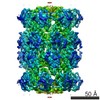
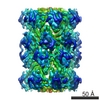
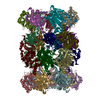
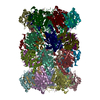
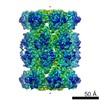
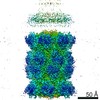
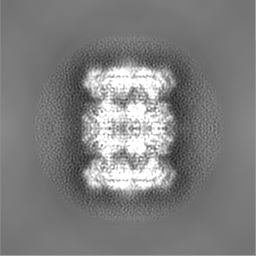
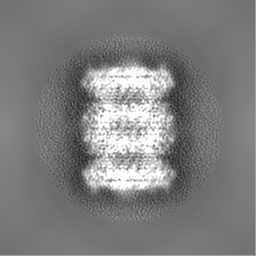
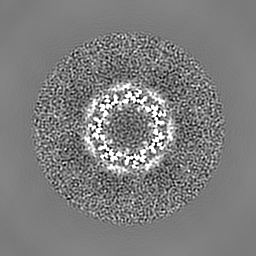
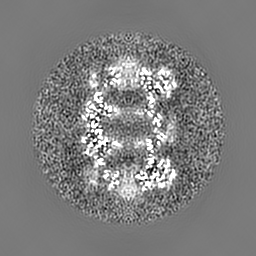
| Title | Thermoplasma acidophilum 20S proteasome | |||||||||
 Map data Map data | Thermoplasma acidophilum 20S proteasome. Reconstruction determined from the first 10,000 particles of a dataset used to calculate map EMD-5623. | |||||||||
 Sample Sample |
| |||||||||
 Keywords Keywords | T. acidophilum 20S proteasome | |||||||||
| Biological species |   Thermoplasma acidophilum (acidophilic) Thermoplasma acidophilum (acidophilic) | |||||||||
| Method | single particle reconstruction / cryo EM / Resolution: 3.6 Å | |||||||||
 Authors Authors | Li X / Cheng Y | |||||||||
 Citation Citation | Journal: J Struct Biol / Year: 2013 Title: Influence of electron dose rate on electron counting images recorded with the K2 camera. Authors: Xueming Li / Shawn Q Zheng / Kiyoshi Egami / David A Agard / Yifan Cheng /  Abstract: A recent technological breakthrough in electron cryomicroscopy (cryoEM) is the development of direct electron detection cameras for data acquisition. By bypassing the traditional phosphor ...A recent technological breakthrough in electron cryomicroscopy (cryoEM) is the development of direct electron detection cameras for data acquisition. By bypassing the traditional phosphor scintillator and fiber optic coupling, these cameras have greatly enhanced sensitivity and detective quantum efficiency (DQE). Of the three currently available commercial cameras, the Gatan K2 Summit was designed specifically for counting individual electron events. Counting further enhances the DQE, allows for practical doubling of detector resolution and eliminates noise arising from the variable deposition of energy by each primary electron. While counting has many advantages, undercounting of electrons happens when more than one electron strikes the same area of the detector within the analog readout period (coincidence loss), which influences image quality. In this work, we characterized the K2 Summit in electron counting mode, and studied the relationship of dose rate and coincidence loss and its influence on the quality of counted images. We found that coincidence loss reduces low frequency amplitudes but has no significant influence on the signal-to-noise ratio of the recorded image. It also has little influence on high frequency signals. Images of frozen hydrated archaeal 20S proteasome (~700 kDa, D7 symmetry) recorded at the optimal dose rate retained both high-resolution signal and low-resolution contrast and enabled calculating a 3.6 Å three-dimensional reconstruction from only 10,000 particles. | |||||||||
| History |
|
- Structure visualization
| Movie |
 Movie viewer Movie viewer |
|---|---|
| Structure viewer | EM map: SurfViewMolmilJmol/JSmol |
| Supplemental images |

- Downloads & links
-EMDB archive
| Map data | emd_6244.map.gz | 59.1 MB | EMDB map data format | |
|---|---|---|---|---|
| Header (meta data) | emd-6244-v30.xmlemd-6244.xml | 8.6 KB 8.6 KB | Display Display | EMDB header |
| Images |  400_6244.gif 400_6244.gif 80_6244.gif 80_6244.gif | 58.9 KB 4.6 KB | ||
| Others | emd_6244_half_map_1.map.gzemd_6244_half_map_2.map.gz | 56.7 MB 56.6 MB | ||
| Archive directory |  http://ftp.pdbj.org/pub/emdb/structures/EMD-6244ftp://ftp.pdbj.org/pub/emdb/structures/EMD-6244 http://ftp.pdbj.org/pub/emdb/structures/EMD-6244ftp://ftp.pdbj.org/pub/emdb/structures/EMD-6244 | HTTPS FTP |
-Related structure data
| Related structure data | |
|---|---|
| Similar structure data |


-Links
| EMDB pages | EMDB (EBI/PDBe) / EMDataResource |
|---|
-Map
| File | Download / File: emd_6244.map.gz / Format: CCP4 / Size: 62.5 MB / Type: IMAGE STORED AS FLOATING POINT NUMBER (4 BYTES) | ||||||||||||||||||||||||||||||||||||||||||||||||||||||||||||||||||||
|---|---|---|---|---|---|---|---|---|---|---|---|---|---|---|---|---|---|---|---|---|---|---|---|---|---|---|---|---|---|---|---|---|---|---|---|---|---|---|---|---|---|---|---|---|---|---|---|---|---|---|---|---|---|---|---|---|---|---|---|---|---|---|---|---|---|---|---|---|---|
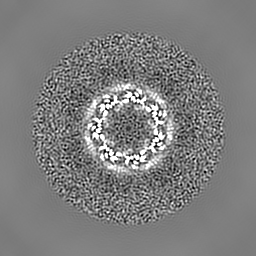
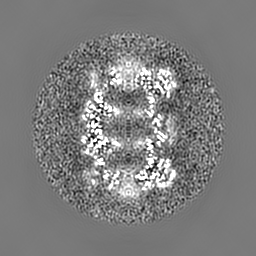
| Annotation | Thermoplasma acidophilum 20S proteasome. Reconstruction determined from the first 10,000 particles of a dataset used to calculate map EMD-5623. | ||||||||||||||||||||||||||||||||||||||||||||||||||||||||||||||||||||
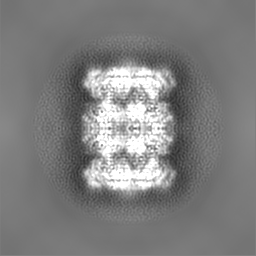
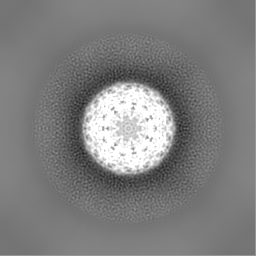
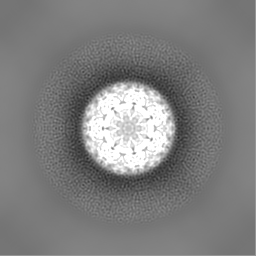
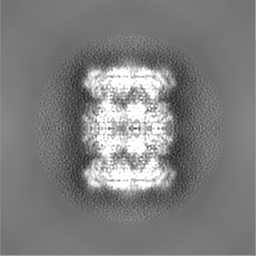
| Projections & slices | Image control
Images are generated by Spider. | ||||||||||||||||||||||||||||||||||||||||||||||||||||||||||||||||||||
| Voxel size | X=Y=Z: 1.2156 Å | ||||||||||||||||||||||||||||||||||||||||||||||||||||||||||||||||||||
| Density |
| ||||||||||||||||||||||||||||||||||||||||||||||||||||||||||||||||||||
| Symmetry | Space group: 1 | ||||||||||||||||||||||||||||||||||||||||||||||||||||||||||||||||||||
| Details | EMDB XML:
CCP4 map header:
| ||||||||||||||||||||||||||||||||||||||||||||||||||||||||||||||||||||
 Z (Sec.)
 Y (Row.)
 X (Col.)


-Supplemental data
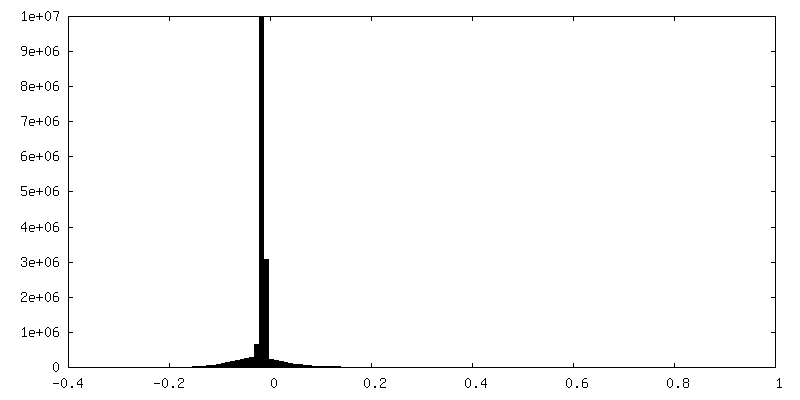
-Supplemental map: emd 6244 half map 1.map
| File | emd_6244_half_map_1.map | ||||||||||||
|---|---|---|---|---|---|---|---|---|---|---|---|---|---|
| Projections & Slices |
| ||||||||||||
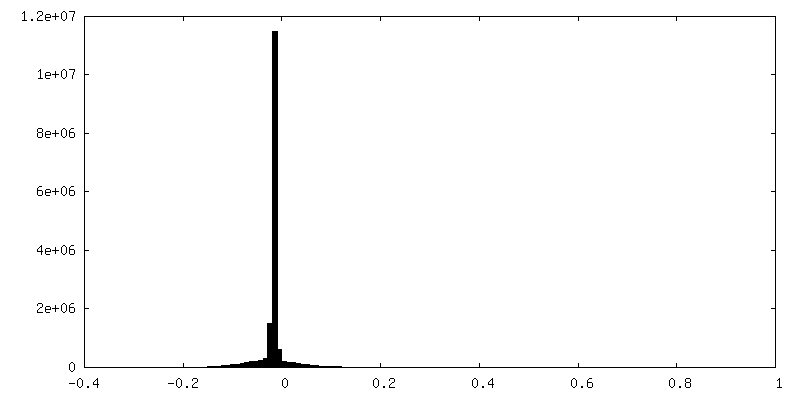
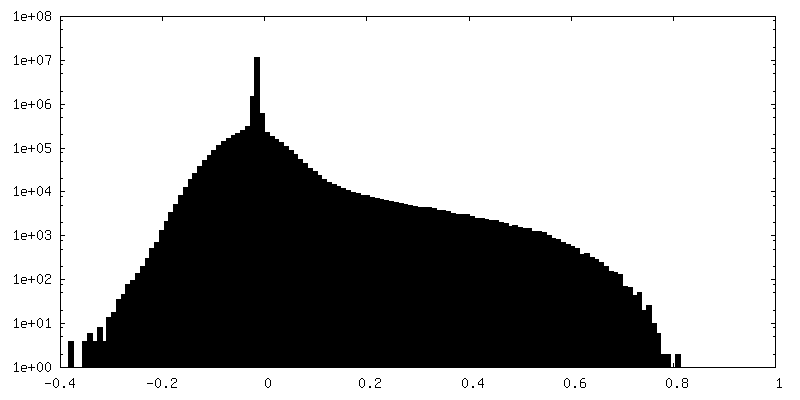
| Density Histograms |

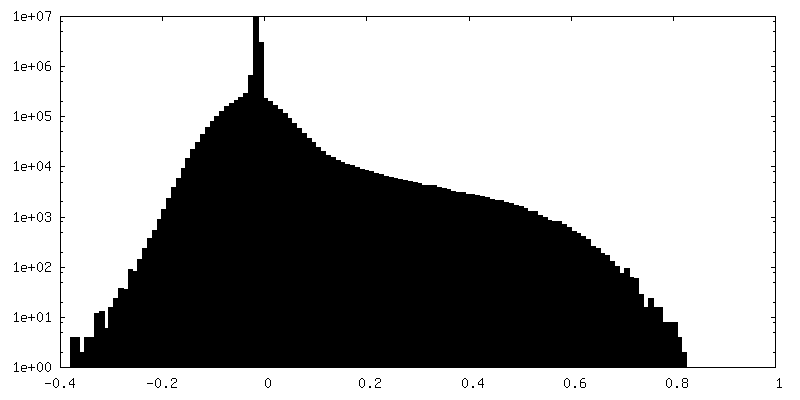
-Supplemental map: emd 6244 half map 2.map
| File | emd_6244_half_map_2.map | ||||||||||||
|---|---|---|---|---|---|---|---|---|---|---|---|---|---|
| Projections & Slices |
| ||||||||||||
| Density Histograms |


- Sample components
-Entire : Thermoplasma acidophilum 20S proteasome
| Entire | Name: Thermoplasma acidophilum 20S proteasome |
|---|---|
| Components |
|
-Supramolecule #1000: Thermoplasma acidophilum 20S proteasome
| Supramolecule | Name: Thermoplasma acidophilum 20S proteasome / type: sample / ID: 1000 / Details: The sample was monodisperse. / Oligomeric state: 28-mer / Number unique components: 1 |
|---|---|
| Molecular weight | Experimental: 700 KDa |
-Macromolecule #1: Thermoplasma acidophilum 20S proteasome
| Macromolecule | Name: Thermoplasma acidophilum 20S proteasome / type: protein_or_peptide / ID: 1 / Number of copies: 2 / Oligomeric state: 28-mer / Recombinant expression: Yes |
|---|---|
| Source (natural) | Organism: Thermoplasma acidophilum (acidophilic) |
| Molecular weight | Experimental: 700 KDa |
| Recombinant expression | Organism:  |
-Experimental details
-Structure determination
| Method | cryo EM |
|---|---|
 Processing Processing | single particle reconstruction |
| Aggregation state | particle |
-Sample preparation
| Vitrification | Cryogen name: ETHANE / Instrument: FEI VITROBOT MARK III |
|---|
- Electron microscopy
| Microscope | FEI POLARA 300 |
|---|---|
| Date | Jan 1, 2012 |
| Image recording | Category: CCD / Film or detector model: GATAN K2 (4k x 4k) / Average electron dose: 20 e/Å2 |
| Electron beam | Acceleration voltage: 300 kV / Electron source:  FIELD EMISSION GUN FIELD EMISSION GUN |
| Electron optics | Illumination mode: FLOOD BEAM / Imaging mode: BRIGHT FIELD / Cs: 2.0 mm / Nominal defocus max: 1.8 µm / Nominal defocus min: 0.9 µm / Nominal magnification: 31000 |
| Sample stage | Specimen holder model: SIDE ENTRY, EUCENTRIC |
| Experimental equipment | 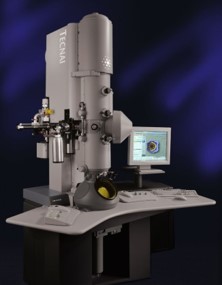 Model: Tecnai Polara / Image courtesy: FEI Company |
-Image processing
| Details | FREALIGN |
|---|---|
| Final reconstruction | Resolution.type: BY AUTHOR / Resolution: 3.6 Å / Resolution method: OTHER / Number images used: 10000 |
