 Movie
Movie Controller

[English] 日本語
 Yorodumi
- EMDB-5548: Signaling in Chemoreceptor Arrays Through Mobility Control of Kin... -
+ Open data

- Basic information
| Entry | Database: EMDB / ID: EMD-5548 | |||||||||
|---|---|---|---|---|---|---|---|---|---|---|
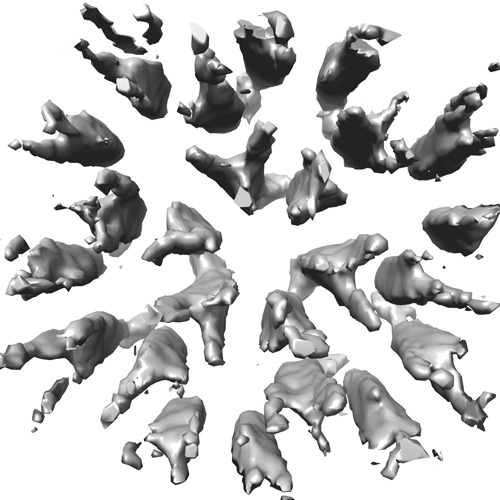
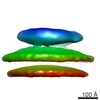
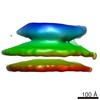
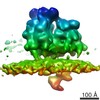
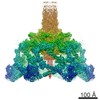
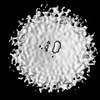
| Title | Signaling in Chemoreceptor Arrays Through Mobility Control of Kinase Domains - high kinase activity state - tsr mutant QEQE | |||||||||
 Map data Map data | Subvolume average of chemoreceptor wild-type tsr QEQE/CheA/CheW | |||||||||
 Sample Sample |
| |||||||||
 Keywords Keywords | chemotaxis / E.coli / CheA | |||||||||
| Biological species |  | |||||||||
| Method | subtomogram averaging / cryo EM / Resolution: 25.0 Å | |||||||||
 Authors Authors | Briegel A / Ames P / Gumbart JC / Oikonomou CM / Parkinson JS / Jensen GJ | |||||||||
 Citation Citation | Journal: Mol Microbiol / Year: 2013 Title: The mobility of two kinase domains in the Escherichia coli chemoreceptor array varies with signalling state. Authors: Ariane Briegel / Peter Ames / James C Gumbart / Catherine M Oikonomou / John S Parkinson / Grant J Jensen /  Abstract: Motile bacteria sense their physical and chemical environment through highly cooperative, ordered arrays of chemoreceptors. These signalling complexes phosphorylate a response regulator which in turn ...Motile bacteria sense their physical and chemical environment through highly cooperative, ordered arrays of chemoreceptors. These signalling complexes phosphorylate a response regulator which in turn governs flagellar motor reversals, driving cells towards favourable environments. The structural changes that translate chemoeffector binding into the appropriate kinase output are not known. Here, we apply high-resolution electron cryotomography to visualize mutant chemoreceptor signalling arrays in well-defined kinase activity states. The arrays were well ordered in all signalling states, with no discernible differences in receptor conformation at 2-3 nm resolution. Differences were observed, however, in a keel-like density that we identify here as CheA kinase domains P1 and P2, the phosphorylation site domain and the binding domain for response regulator target proteins. Mutant receptor arrays with high kinase activities all exhibited small keels and high proteolysis susceptibility, indicative of mobile P1 and P2 domains. In contrast, arrays in kinase-off signalling states exhibited a range of keel sizes. These findings confirm that chemoreceptor arrays do not undergo large structural changes during signalling, and suggest instead that kinase activity is modulated at least in part by changes in the mobility of key domains. | |||||||||
| History |
|
- Structure visualization
| Movie |
 Movie viewer Movie viewer |
|---|---|
| Structure viewer | EM map: SurfViewMolmilJmol/JSmol |
| Supplemental images |

- Downloads & links
-EMDB archive
| Map data | emd_5548.map.gz | 631.6 KB | EMDB map data format | |
|---|---|---|---|---|
| Header (meta data) | emd-5548-v30.xmlemd-5548.xml | 11.2 KB 11.2 KB | Display Display | EMDB header |
| Images | 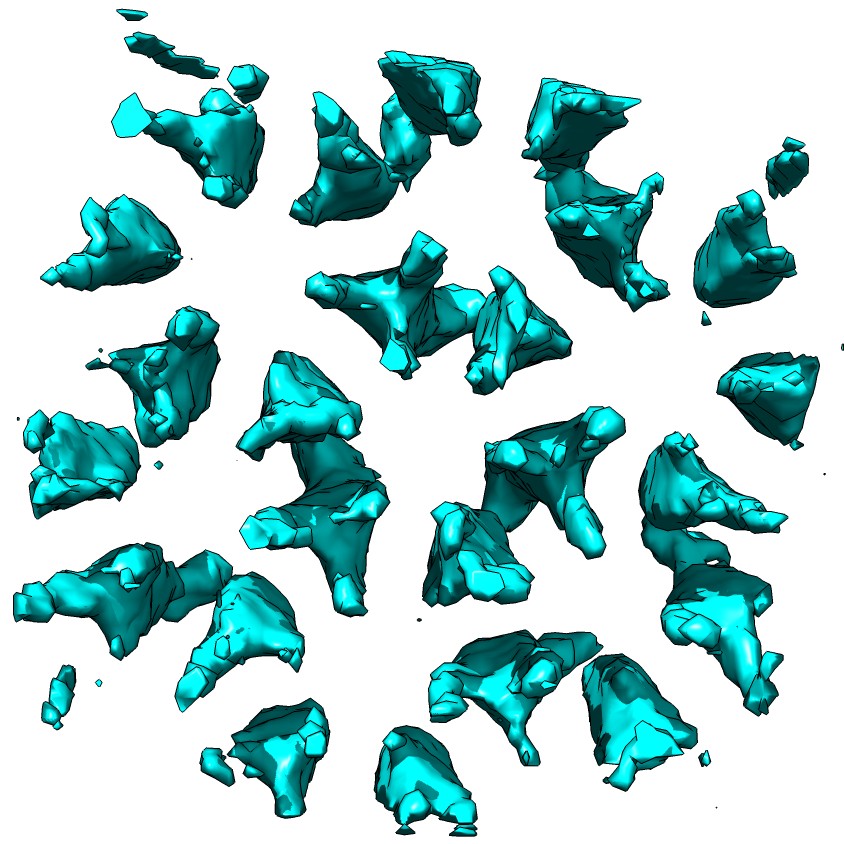 emd_5548_1.jpgemd_5548_2.tif emd_5548_1.jpgemd_5548_2.tif | 164.4 KB 172.6 KB | ||
| Archive directory |  http://ftp.pdbj.org/pub/emdb/structures/EMD-5548ftp://ftp.pdbj.org/pub/emdb/structures/EMD-5548 http://ftp.pdbj.org/pub/emdb/structures/EMD-5548ftp://ftp.pdbj.org/pub/emdb/structures/EMD-5548 | HTTPS FTP |
-Related structure data
| Related structure data |  2414C  5541C  5542C 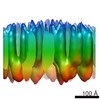 5543C 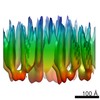 5545C 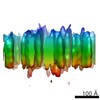 5546C 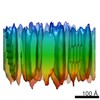 5547C 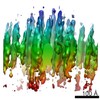 5549C 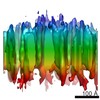 5550C  5716C C: citing same article ( |
|---|---|
| Similar structure data |
-Links
| EMDB pages | EMDB (EBI/PDBe) / EMDataResource |
|---|
-Map
| File | Download / File: emd_5548.map.gz / Format: CCP4 / Size: 825.2 KB / Type: IMAGE STORED AS FLOATING POINT NUMBER (4 BYTES) | ||||||||||||||||||||||||||||||||||||||||||||||||||||||||||||||||||||
|---|---|---|---|---|---|---|---|---|---|---|---|---|---|---|---|---|---|---|---|---|---|---|---|---|---|---|---|---|---|---|---|---|---|---|---|---|---|---|---|---|---|---|---|---|---|---|---|---|---|---|---|---|---|---|---|---|---|---|---|---|---|---|---|---|---|---|---|---|---|
| Annotation | Subvolume average of chemoreceptor wild-type tsr QEQE/CheA/CheW | ||||||||||||||||||||||||||||||||||||||||||||||||||||||||||||||||||||
| Projections & slices | Image control
Images are generated by Spider. | ||||||||||||||||||||||||||||||||||||||||||||||||||||||||||||||||||||
| Voxel size | X=Y=Z: 6.6 Å | ||||||||||||||||||||||||||||||||||||||||||||||||||||||||||||||||||||
| Density |
| ||||||||||||||||||||||||||||||||||||||||||||||||||||||||||||||||||||
| Symmetry | Space group: 1 | ||||||||||||||||||||||||||||||||||||||||||||||||||||||||||||||||||||
| Details | EMDB XML:
CCP4 map header:
| ||||||||||||||||||||||||||||||||||||||||||||||||||||||||||||||||||||
 Z (Sec.)
 Y (Row.)
 X (Col.)


-Supplemental data
- Sample components
-Entire : chemoreceptor array with mutant receptor tsr QEQE
| Entire | Name: chemoreceptor array with mutant receptor tsr QEQE |
|---|---|
| Components |
|
-Supramolecule #1000: chemoreceptor array with mutant receptor tsr QEQE
| Supramolecule | Name: chemoreceptor array with mutant receptor tsr QEQE / type: sample / ID: 1000 / Number unique components: 3 |
|---|
-Macromolecule #1: tsr QEQE
| Macromolecule | Name: tsr QEQE / type: protein_or_peptide / ID: 1 / Recombinant expression: Yes |
|---|---|
| Source (natural) | Organism: |
| Recombinant expression | Organism: |
-Macromolecule #2: CheW
| Macromolecule | Name: CheW / type: protein_or_peptide / ID: 2 / Recombinant expression: No / Database: NCBI |
|---|---|
| Source (natural) | Organism: |
-Macromolecule #3: CheA
| Macromolecule | Name: CheA / type: protein_or_peptide / ID: 3 / Oligomeric state: dimer / Recombinant expression: No / Database: NCBI |
|---|---|
| Source (natural) | Organism: |
-Experimental details
-Structure determination
| Method | cryo EM |
|---|---|
 Processing Processing | subtomogram averaging |
-Sample preparation
| Buffer | Details: Tryptone Broth (10 g/L Tryptone, 5 g/L NaCl). Cells were incubated with penicillin for 1 hour prior to freezing. |
|---|---|
| Grid | Details: R 2/2 copper/rhodium grids, glow discharged |
| Vitrification | Cryogen name: ETHANE-PROPANE MIXTURE / Chamber humidity: 100 % / Instrument: FEI VITROBOT MARK III |
- Electron microscopy
| Microscope | FEI POLARA 300 |
|---|---|
| Specialist optics | Energy filter - Name: FEI / Energy filter - Lower energy threshold: 0.0 eV / Energy filter - Upper energy threshold: 20.0 eV |
| Date | Oct 1, 2012 |
| Image recording | Average electron dose: 150 e/Å2 |
| Electron beam | Acceleration voltage: 300 kV / Electron source:  FIELD EMISSION GUN FIELD EMISSION GUN |
| Electron optics | Illumination mode: FLOOD BEAM / Imaging mode: BRIGHT FIELD / Cs: 2.2 mm / Nominal defocus min: 10.0 µm / Nominal magnification: 34000 |
| Sample stage | Specimen holder model: OTHER / Tilt series - Axis1 - Min angle: -62.4 ° / Tilt series - Axis1 - Max angle: 63.8 ° |
| Experimental equipment | 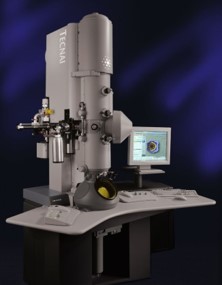 Model: Tecnai Polara / Image courtesy: FEI Company |
-Image processing
| Details | CTF-corrected. Average number of tilts used in the 3D reconstructions: 128. Average tomographic tilt angle increment: 1. |
|---|---|
| Final reconstruction | Resolution.type: BY AUTHOR / Resolution: 25.0 Å / Software - Name: IMOD, tomo3D |
| CTF correction | Details: IMOD |
