- EMDB-3927: Architecture of the human mTORC2 core complex (C2) -
+
Open data
ID or keywords:
Loading...
-
Basic information
Entry
Database: EMDB / ID: EMD-3927
Title
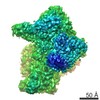
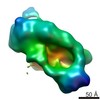
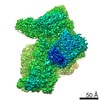
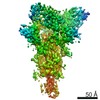
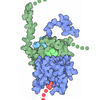
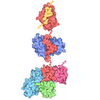
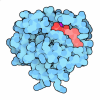
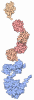
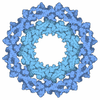
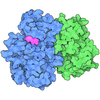
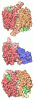
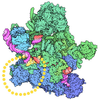
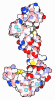
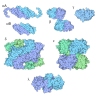
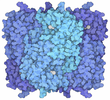
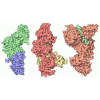
Architecture of the human mTORC2 core complex (C2)
Map data
Human mTORC2 core complex (C2)
Sample
Complex: Human mTORC2 Core Complex (C2)
Function / homology
Function and homology information
cardiac cell development / positive regulation of SCF-dependent proteasomal ubiquitin-dependent catabolic process / RNA polymerase III type 2 promoter sequence-specific DNA binding / T-helper 1 cell lineage commitment / RNA polymerase III type 1 promoter sequence-specific DNA binding / positive regulation of cytoplasmic translational initiation / regulation of locomotor rhythm / positive regulation of pentose-phosphate shunt / positive regulation of wound healing, spreading of epidermal cells / regulation of phosphatidylinositol 3-kinase/protein kinase B signal transduction ...cardiac cell development / positive regulation of SCF-dependent proteasomal ubiquitin-dependent catabolic process / RNA polymerase III type 2 promoter sequence-specific DNA binding / T-helper 1 cell lineage commitment / RNA polymerase III type 1 promoter sequence-specific DNA binding / positive regulation of cytoplasmic translational initiation / regulation of locomotor rhythm / positive regulation of pentose-phosphate shunt / positive regulation of wound healing, spreading of epidermal cells / regulation of phosphatidylinositol 3-kinase/protein kinase B signal transduction / TORC2 complex / cellular response to leucine starvation / TFIIIC-class transcription factor complex binding / regulation of lysosome organization / TORC1 complex / regulation of cellular response to oxidative stress / negative regulation of lysosome organization / regulation of osteoclast differentiation / RNA polymerase III type 3 promoter sequence-specific DNA binding / positive regulation of transcription of nucleolar large rRNA by RNA polymerase I / positive regulation of keratinocyte migration / MTOR signalling / cellular response to L-leucine / Energy dependent regulation of mTOR by LKB1-AMPK / cellular response to nutrient / regulation of autophagosome assembly / Amino acids regulate mTORC1 / negative regulation of Ras protein signal transduction / Dengue virus modulates apoptosis / embryo development ending in birth or egg hatching / phosphatidic acid binding / cellular response to methionine / phosphatidylinositol-3,4-bisphosphate binding / TORC2 signaling / cellular response to osmotic stress / phosphatidylinositol-3,5-bisphosphate binding / anoikis / inositol hexakisphosphate binding / negative regulation of protein localization to nucleus / positive regulation of ubiquitin-dependent protein catabolic process / negative regulation of macroautophagy / regulation of cell size / lipid biosynthetic process / Macroautophagy / Constitutive Signaling by AKT1 E17K in Cancer / positive regulation of transcription by RNA polymerase III / TORC1 signaling / positive regulation of protein kinase activity / behavioral response to pain / phosphatidylinositol-3,4,5-trisphosphate binding / response to amino acid / TOR signaling / mTORC1-mediated signalling / CD28 dependent PI3K/Akt signaling / HSF1-dependent transactivation / positive regulation of TOR signaling / positive regulation of translational initiation / positive regulation of lipid biosynthetic process / enzyme-substrate adaptor activity / positive regulation of epithelial to mesenchymal transition / T cell costimulation / neuronal action potential / vascular endothelial cell response to laminar fluid shear stress / regulation of cellular response to heat / regulation of macroautophagy / 'de novo' pyrimidine nucleobase biosynthetic process / cytoskeleton organization / phagocytic vesicle / positive regulation of endothelial cell proliferation / phosphatidylinositol-4,5-bisphosphate binding / negative regulation of insulin receptor signaling pathway / endomembrane system / substantia nigra development / cellular response to nutrient levels / positive regulation of glycolytic process / negative regulation of autophagy / regulation of signal transduction by p53 class mediator / cellular response to amino acid starvation / cellular response to starvation / Regulation of PTEN gene transcription / cellular response to amino acid stimulus / protein serine/threonine kinase activator activity / VEGFR2 mediated vascular permeability / phosphatidylinositol 3-kinase/protein kinase B signal transduction / positive regulation of translation / regulation of actin cytoskeleton organization / TP53 Regulates Metabolic Genes / non-specific protein-tyrosine kinase / regulation of cell growth / non-membrane spanning protein tyrosine kinase activity / phosphoprotein binding / response to nutrient levels / PML body / regulation of circadian rhythm / small GTPase binding / cellular response to insulin stimulus / Regulation of TP53 Degradation / late endosome / nuclear envelope / PIP3 activates AKT signaling Similarity search - Function
TORC2 component Bit61/PRR5 / HbrB-like / Rapamycin-insensitive companion of mTOR, phosphorylation-site / Rapamycin-insensitive companion of mTOR, phosphorylation-site / Rapamycin-insensitive companion of mTOR, phosphorylation-site / Rapamycin-insensitive companion of mTOR, N-terminal domain / Pianissimo family / Rapamycin-insensitive companion of mTOR, middle domain / Rapamycin-insensitive companion of mTOR, domain 5 / Rapamycin-insensitive companion of mTOR, domain 4 ...TORC2 component Bit61/PRR5 / HbrB-like / Rapamycin-insensitive companion of mTOR, phosphorylation-site / Rapamycin-insensitive companion of mTOR, phosphorylation-site / Rapamycin-insensitive companion of mTOR, phosphorylation-site / Rapamycin-insensitive companion of mTOR, N-terminal domain / Pianissimo family / Rapamycin-insensitive companion of mTOR, middle domain / Rapamycin-insensitive companion of mTOR, domain 5 / Rapamycin-insensitive companion of mTOR, domain 4 / Rapamycin-insensitive companion of mTOR RasGEF_N domain / Rapamycin-insensitive companion of mTOR, N-term / Rapamycin-insensitive companion of mTOR, middle domain / Rapamycin-insensitive companion of mTOR, domain 5 / Rapamycin-insensitive companion of mTOR RasGEF_N domain / Rapamycin-insensitive companion of mTOR, middle domain / Rapamycin-insensitive companion of mTOR, N-term / Rapamycin-insensitive companion of mTOR, domain 5 / : / SIN1 Ras-binding domain / Sin1, N-terminal / Stress-activated map kinase interacting protein 1 (SIN1) / TORC2 component Sin1/Avo1 / SAPK-interacting protein 1, Pleckstrin-homology domain / Sin1, middle CRIM domain / SAPK-interacting protein 1 (Sin1), middle CRIM domain / SAPK-interacting protein 1 (Sin1), Pleckstrin-homology / Target of rapamycin complex subunit LST8 / Domain of unknown function DUF3385, target of rapamycin protein / Serine/threonine-protein kinase mTOR domain / Domain of unknown function / FKBP12-rapamycin binding domain / Serine/threonine-protein kinase TOR / FKBP12-rapamycin binding domain superfamily / FKBP12-rapamycin binding domain / Rapamycin binding domain / : / Serine/threonine-protein kinase ATR-like, HEAT repeats / Cullin repeat-like-containing domain superfamily / : / FATC domain / PIK-related kinase, FAT / FAT domain / FATC / FATC domain / PIK-related kinase / FAT domain profile. / FATC domain profile. / Quinoprotein alcohol dehydrogenase-like superfamily / Phosphatidylinositol 3- and 4-kinases signature 1. / Phosphatidylinositol 3/4-kinase, conserved site / Phosphatidylinositol 3- and 4-kinases signature 2. / Phosphatidylinositol 3-/4-kinase, catalytic domain superfamily / Phosphoinositide 3-kinase, catalytic domain / Phosphatidylinositol 3- and 4-kinase / Phosphatidylinositol 3- and 4-kinases catalytic domain profile. / Phosphatidylinositol 3-/4-kinase, catalytic domain / Armadillo-like helical / PH-like domain superfamily / Tetratricopeptide-like helical domain superfamily / WD domain, G-beta repeat / Armadillo-type fold / G-protein beta WD-40 repeat / WD40 repeat, conserved site / Trp-Asp (WD) repeats signature. / Trp-Asp (WD) repeats profile. / Trp-Asp (WD) repeats circular profile. / WD40 repeats / WD40 repeat / WD40/YVTN repeat-like-containing domain superfamily / Protein kinase-like domain superfamily Similarity search - Domain/homology
Serine/threonine-protein kinase mTOR / Proline-rich protein 5 / Rapamycin-insensitive companion of mTOR / Target of rapamycin complex 2 subunit MAPKAP1 / Target of rapamycin complex subunit LST8 Similarity search - Component
Biological species
Homo sapiens (human)
Method
single particle reconstruction / cryo EM / Resolution: 7.4 Å
Journal: Elife / Year: 2018 Title: Architecture of the human mTORC2 core complex. Authors: Edward Stuttfeld / Christopher Hs Aylett / Stefan Imseng / Daniel Boehringer / Alain Scaiola / Evelyn Sauer / Michael N Hall / Timm Maier / Nenad Ban / Abstract: The mammalian target of rapamycin (mTOR) is a key protein kinase controlling cellular metabolism and growth. It is part of the two structurally and functionally distinct multiprotein complexes mTORC1 ...The mammalian target of rapamycin (mTOR) is a key protein kinase controlling cellular metabolism and growth. It is part of the two structurally and functionally distinct multiprotein complexes mTORC1 and mTORC2. Dysregulation of mTOR occurs in diabetes, cancer and neurological disease. We report the architecture of human mTORC2 at intermediate resolution, revealing a conserved binding site for accessory proteins on mTOR and explaining the structural basis for the rapamycin insensitivity of the complex.
History
Deposition
Oct 15, 2017
-
Header (metadata) release
Dec 20, 2017
-
Map release
Feb 28, 2018
-
Update
Feb 28, 2018
-
Current status
Feb 28, 2018
Processing site: PDBe / Status: Released
-
Structure visualization
Movie
Surface view with section colored by density value
Cryogen name: ETHANE-PROPANE / Chamber humidity: 95 % / Chamber temperature: 277 K / Instrument: FEI VITROBOT MARK IV / Details: Two seconds blotting.
Details
Sample was prepared by a modified GRAFIX protocol described in the paper, and was extremely dilute. Particles were adhered to a thin carbon film to obtain reasonable coverage.
-
Electron microscopy
Microscope
FEI TITAN KRIOS
Temperature
Min: 100.0 K / Max: 100.0 K
Specialist optics
Energy filter - Name: GIF Quantum SE
Image recording
Film or detector model: GATAN K2 SUMMIT (4k x 4k) / Detector mode: COUNTING / Digitization - Dimensions - Width: 3838 pixel / Digitization - Dimensions - Height: 3710 pixel / Digitization - Sampling interval: 5.0 µm / Digitization - Frames/image: 1-40 / Number grids imaged: 1 / Number real images: 3997 / Average exposure time: 20.0 sec. / Average electron dose: 80.0 e/Å2 / Details: Dose weighting applied
Electron beam
Acceleration voltage: 300 kV / Electron source: FIELD EMISSION GUN
In the structure databanks used in Yorodumi, some data are registered as the other names, "COVID-19 virus" and "2019-nCoV". Here are the details of the virus and the list of structure data.
Jan 31, 2019. EMDB accession codes are about to change! (news from PDBe EMDB page)
EMDB accession codes are about to change! (news from PDBe EMDB page)
The allocation of 4 digits for EMDB accession codes will soon come to an end. Whilst these codes will remain in use, new EMDB accession codes will include an additional digit and will expand incrementally as the available range of codes is exhausted. The current 4-digit format prefixed with “EMD-” (i.e. EMD-XXXX) will advance to a 5-digit format (i.e. EMD-XXXXX), and so on. It is currently estimated that the 4-digit codes will be depleted around Spring 2019, at which point the 5-digit format will come into force.
The EM Navigator/Yorodumi systems omit the EMD- prefix.
Related info.:Q: What is EMD? / ID/Accession-code notation in Yorodumi/EM Navigator
Yorodumi is a browser for structure data from EMDB, PDB, SASBDB, etc.
This page is also the successor to EM Navigator detail page, and also detail information page/front-end page for Omokage search.
The word "yorodu" (or yorozu) is an old Japanese word meaning "ten thousand". "mi" (miru) is to see.
Related info.:EMDB / PDB / SASBDB / Comparison of 3 databanks / Yorodumi Search / Aug 31, 2016. New EM Navigator & Yorodumi / Yorodumi Papers / Jmol/JSmol / Function and homology information / Changes in new EM Navigator and Yorodumi
 Movie
Movie Controller


 Open data
 Basic information
 Map data
 Sample
 Function and homology information
 Homo sapiens (human)
 Authors
 Citation
 Structure visualization
 Downloads & links
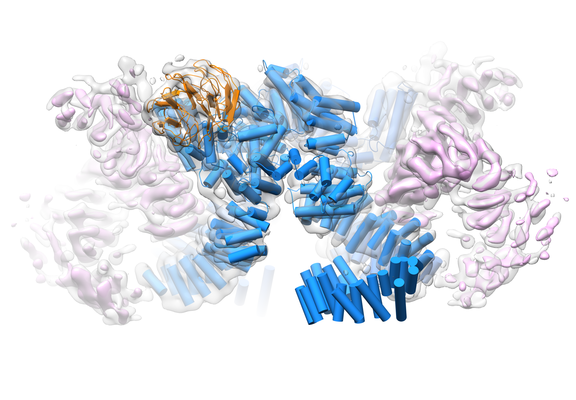 emd_3927.png
 http://ftp.pdbj.org/pub/emdb/structures/EMD-3927

 Z (Sec.)
 Y (Row.)
 X (Col.)


 Sample components
 Spodoptera frugiperda (fall armyworm) / Recombinant cell: Sf9 / Recombinant plasmid: Multibac
 Processing
 Electron microscopy
 FIELD EMISSION GUN

