 Movie
Movie Controller

[English] 日本語
 Yorodumi
- EMDB-2091: Electron cryomicroscopy of the bovine mitochondrial ATP synthase -
+ Open data

- Basic information
| Entry | Database: EMDB / ID: EMD-2091 | |||||||||
|---|---|---|---|---|---|---|---|---|---|---|
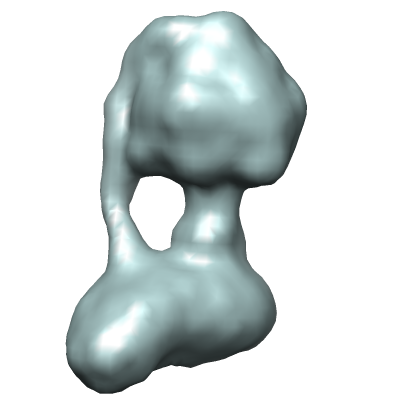
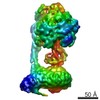
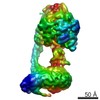
| Title | Electron cryomicroscopy of the bovine mitochondrial ATP synthase | |||||||||
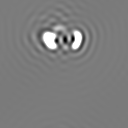
 Map data Map data | 3D map of bovine ATP synthase | |||||||||
 Sample Sample |
| |||||||||
 Keywords Keywords | bioenergetics / membrane | |||||||||
| Biological species |  | |||||||||
| Method | single particle reconstruction / cryo EM / Resolution: 18.0 Å | |||||||||
 Authors Authors | Baker LA / Watt IN / Runswick MJ / Walker JE / Rubinstein JL | |||||||||
 Citation Citation | Journal: Proc Natl Acad Sci U S A / Year: 2012 Title: Arrangement of subunits in intact mammalian mitochondrial ATP synthase determined by cryo-EM. Authors: Lindsay A Baker / Ian N Watt / Michael J Runswick / John E Walker / John L Rubinstein /  Abstract: Mitochondrial ATP synthase is responsible for the synthesis of ATP, a universal energy currency in cells. Whereas X-ray crystallography has revealed the structure of the soluble region of the complex ...Mitochondrial ATP synthase is responsible for the synthesis of ATP, a universal energy currency in cells. Whereas X-ray crystallography has revealed the structure of the soluble region of the complex and the membrane-intrinsic c-subunits, little is known about the structure of the six other proteins (a, b, f, A6L, e, and g) that comprise the membrane-bound region of the complex in animal mitochondria. Here, we present the structure of intact bovine mitochondrial ATP synthase at ∼18 Å resolution by electron cryomicroscopy of single particles in amorphous ice. The map reveals that the a-subunit and c(8)-ring of the complex interact with a small contact area and that the b-subunit spans the membrane without contacting the c(8)-ring. The e- and g-subunits extend from the a-subunit density distal to the c(8)-ring. The map was calculated from images of a preparation of the enzyme solubilized with the detergent dodecyl maltoside, which is visible in electron cryomicroscopy maps. The structure shows that the micelle surrounding the complex is curved. The observed bend in the micelle of the detergent-solubilized complex is consistent with previous electron tomography experiments and suggests that monomers of ATP synthase are sufficient to produce curvature in lipid bilayers. | |||||||||
| History |
|
- Structure visualization
| Movie |
 Movie viewer Movie viewer |
|---|---|
| Structure viewer | EM map: SurfViewMolmilJmol/JSmol |
| Supplemental images |
- Downloads & links
-EMDB archive
| Map data | emd_2091.map.gz | 7.4 MB | EMDB map data format | |
|---|---|---|---|---|
| Header (meta data) | emd-2091-v30.xmlemd-2091.xml | 29.9 KB 29.9 KB | Display Display | EMDB header |
| Images |  emd_2091.png emd_2091.png | 48.2 KB | ||
| Masks | emd_2091_msk_1.mapemd_2091_msk_10.mapemd_2091_msk_2.mapemd_2091_msk_3.mapemd_2091_msk_4.mapemd_2091_msk_5.mapemd_2091_msk_6.mapemd_2091_msk_7.mapemd_2091_msk_8.mapemd_2091_msk_9.map | 8 MB 8 MB 8 MB 8 MB 8 MB 8 MB 8 MB 8 MB 8 MB 8 MB | Mask map | |
| Archive directory |  http://ftp.pdbj.org/pub/emdb/structures/EMD-2091ftp://ftp.pdbj.org/pub/emdb/structures/EMD-2091 http://ftp.pdbj.org/pub/emdb/structures/EMD-2091ftp://ftp.pdbj.org/pub/emdb/structures/EMD-2091 | HTTPS FTP |
-Related structure data
| Similar structure data |
|---|


-Links
| EMDB pages | EMDB (EBI/PDBe) / EMDataResource |
|---|
-Map
| File | Download / File: emd_2091.map.gz / Format: CCP4 / Size: 7.8 MB / Type: IMAGE STORED AS FLOATING POINT NUMBER (4 BYTES) | ||||||||||||||||||||||||||||||||||||||||||||||||||||||||||||||||||||
|---|---|---|---|---|---|---|---|---|---|---|---|---|---|---|---|---|---|---|---|---|---|---|---|---|---|---|---|---|---|---|---|---|---|---|---|---|---|---|---|---|---|---|---|---|---|---|---|---|---|---|---|---|---|---|---|---|---|---|---|---|---|---|---|---|---|---|---|---|---|
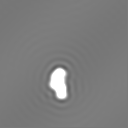
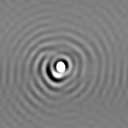
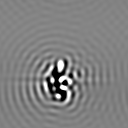
| Annotation | 3D map of bovine ATP synthase | ||||||||||||||||||||||||||||||||||||||||||||||||||||||||||||||||||||
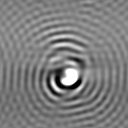
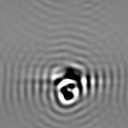
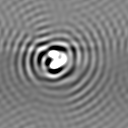
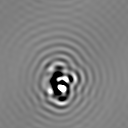
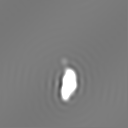
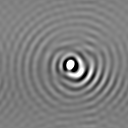
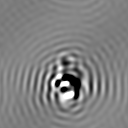
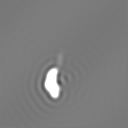
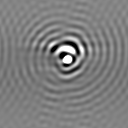
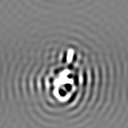
| Projections & slices | Image control
Images are generated by Spider. | ||||||||||||||||||||||||||||||||||||||||||||||||||||||||||||||||||||
| Voxel size | X=Y=Z: 2.8 Å | ||||||||||||||||||||||||||||||||||||||||||||||||||||||||||||||||||||
| Density |
| ||||||||||||||||||||||||||||||||||||||||||||||||||||||||||||||||||||
| Symmetry | Space group: 1 | ||||||||||||||||||||||||||||||||||||||||||||||||||||||||||||||||||||
| Details | EMDB XML:
CCP4 map header:
| ||||||||||||||||||||||||||||||||||||||||||||||||||||||||||||||||||||
 Z (Sec.)
 Y (Row.)
 X (Col.)


-Supplemental data
-Segmentation: #2
| File | emd_2091_msk_1.map | ||||||||||||
|---|---|---|---|---|---|---|---|---|---|---|---|---|---|
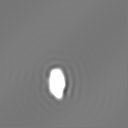
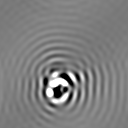
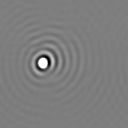
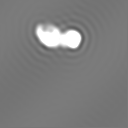
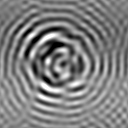
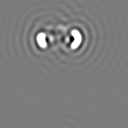
| Projections & Slices |
| ||||||||||||
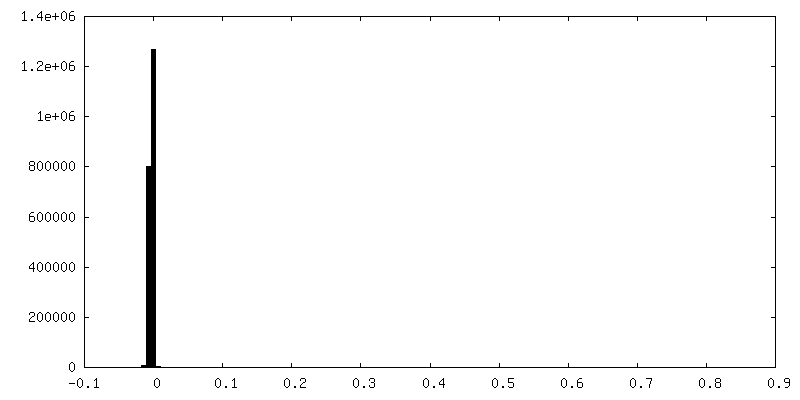
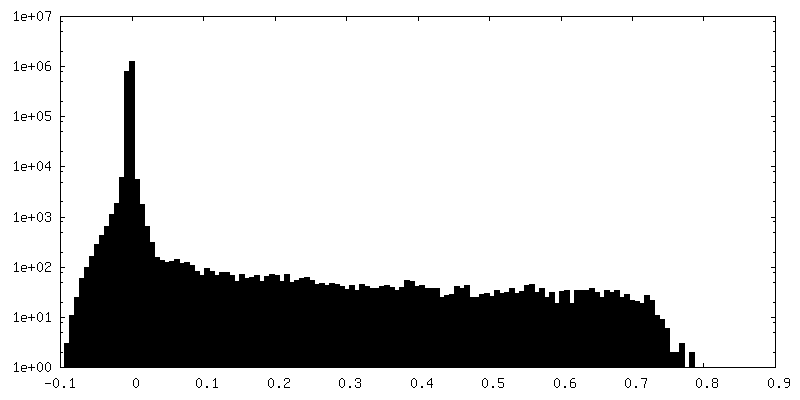
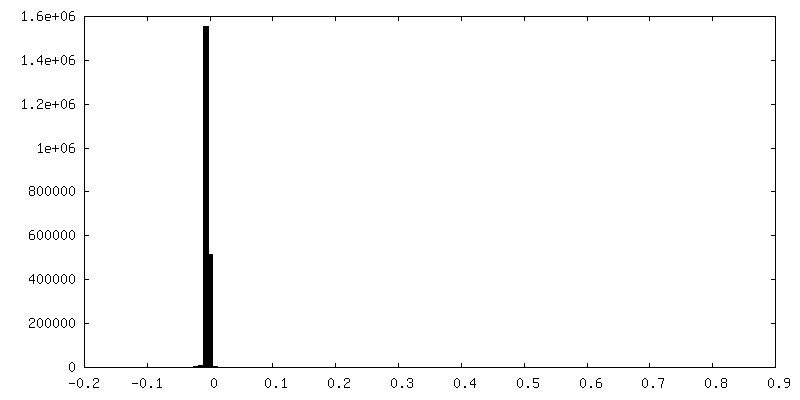
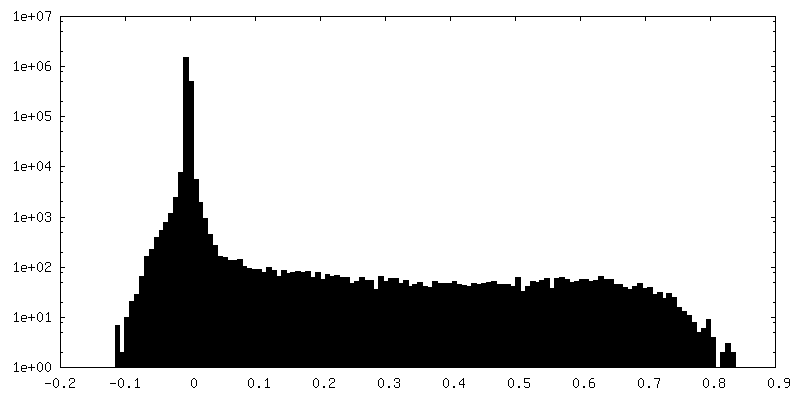
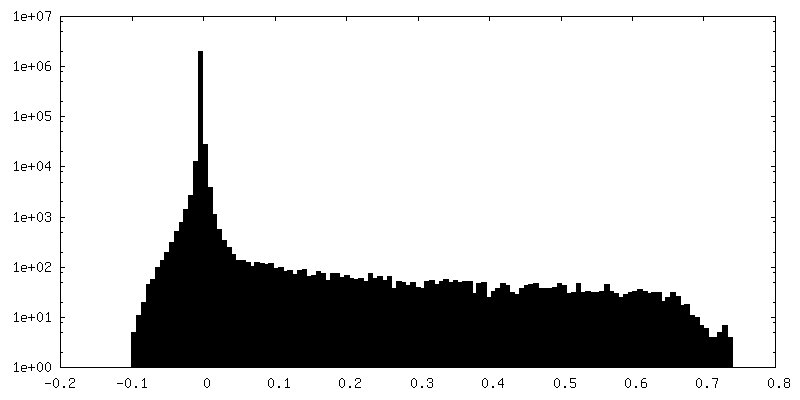
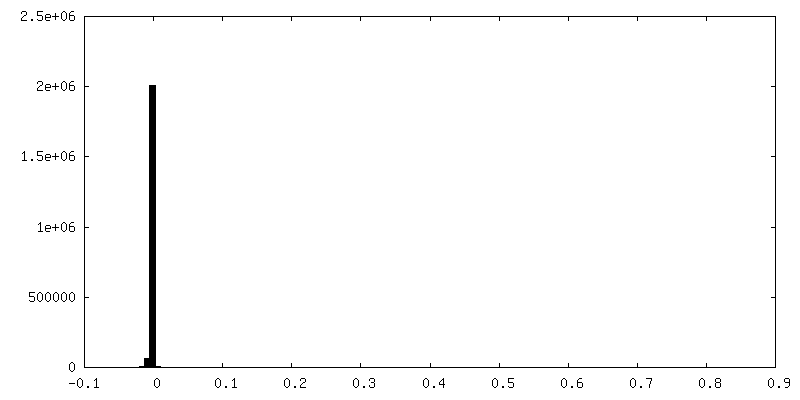
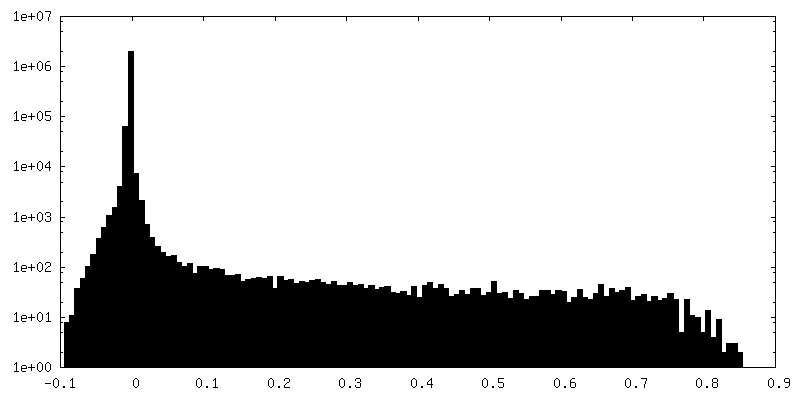
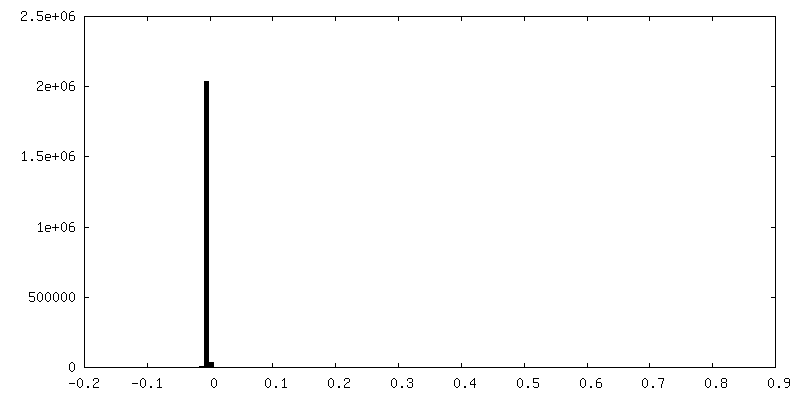
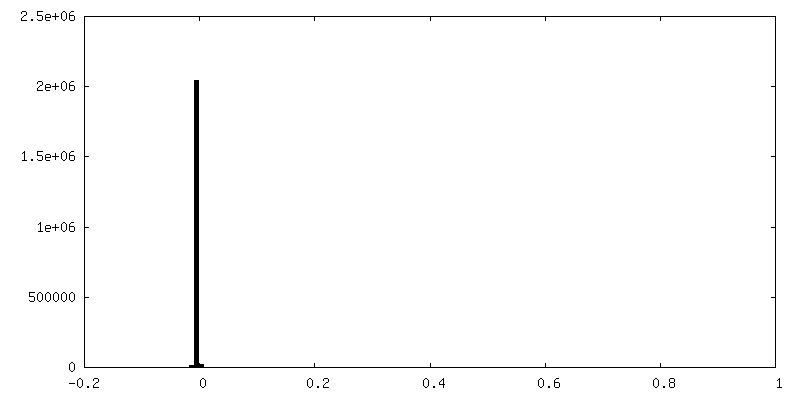
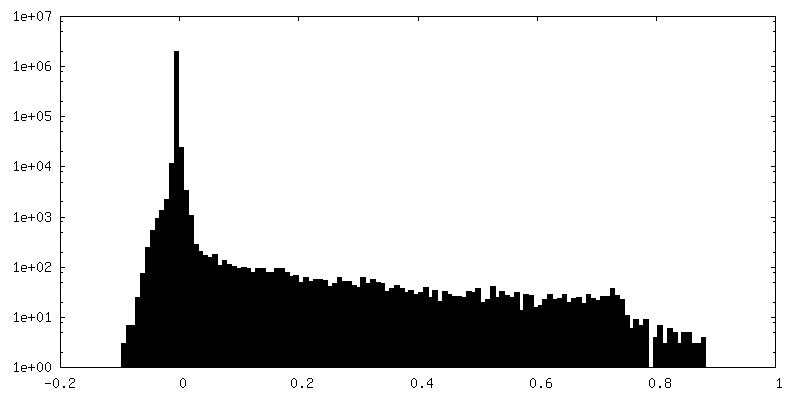
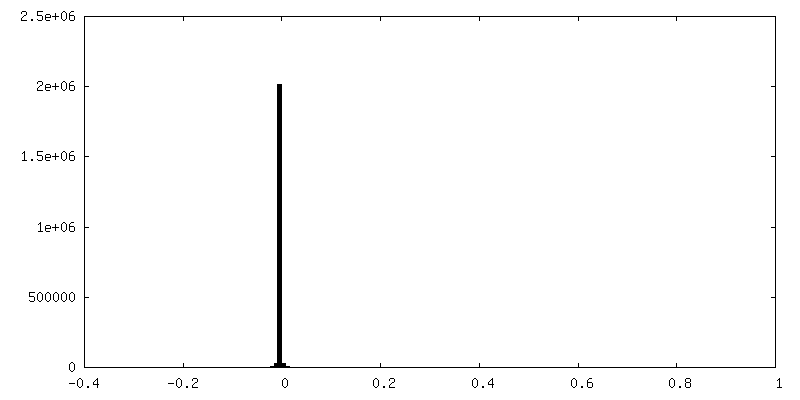
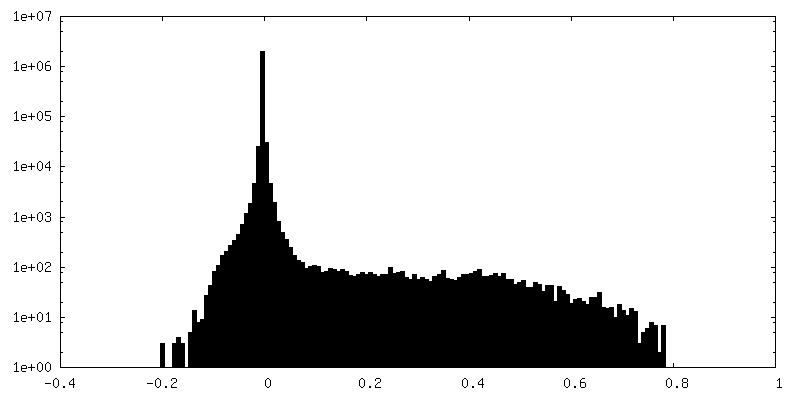
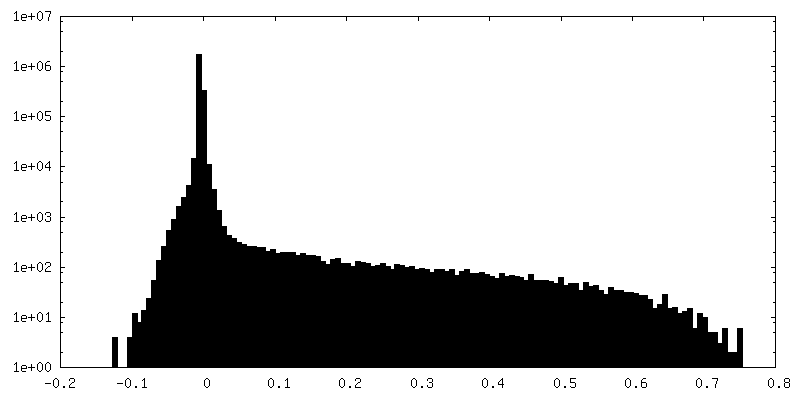
| Density Histograms |


-Segmentation: #1
| File | emd_2091_msk_10.map | ||||||||||||
|---|---|---|---|---|---|---|---|---|---|---|---|---|---|
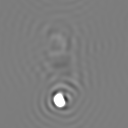
| Projections & Slices |
| ||||||||||||
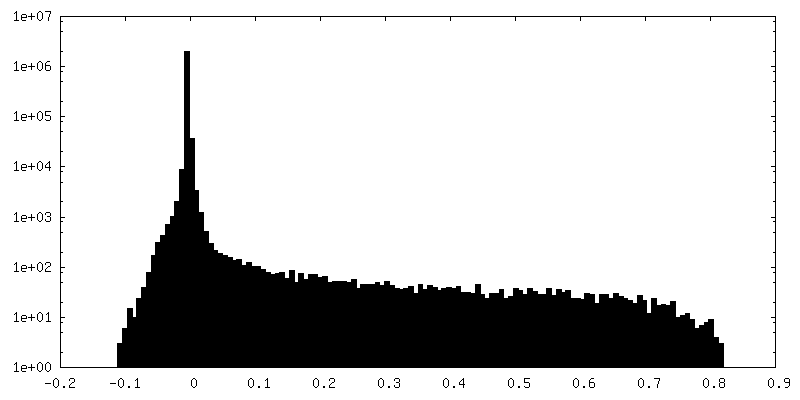
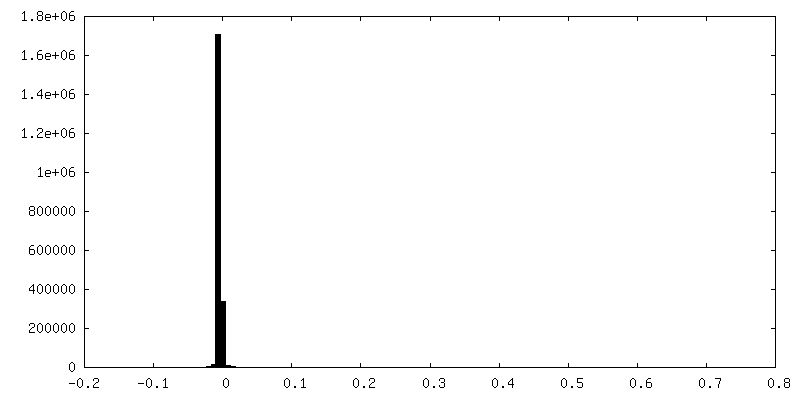
| Density Histograms |


-Segmentation: #3
| File | emd_2091_msk_2.map | ||||||||||||
|---|---|---|---|---|---|---|---|---|---|---|---|---|---|
| Projections & Slices |
| ||||||||||||
| Density Histograms |


-Segmentation: #4
| File | emd_2091_msk_3.map | ||||||||||||
|---|---|---|---|---|---|---|---|---|---|---|---|---|---|
| Projections & Slices |
| ||||||||||||
| Density Histograms |


-Segmentation: #5
| File | emd_2091_msk_4.map | ||||||||||||
|---|---|---|---|---|---|---|---|---|---|---|---|---|---|
| Projections & Slices |
| ||||||||||||
| Density Histograms |


-Segmentation: #6
| File | emd_2091_msk_5.map | ||||||||||||
|---|---|---|---|---|---|---|---|---|---|---|---|---|---|
| Projections & Slices |
| ||||||||||||
| Density Histograms |


-Segmentation: #7
| File | emd_2091_msk_6.map | ||||||||||||
|---|---|---|---|---|---|---|---|---|---|---|---|---|---|
| Projections & Slices |
| ||||||||||||
| Density Histograms |


-Segmentation: #8
| File | emd_2091_msk_7.map | ||||||||||||
|---|---|---|---|---|---|---|---|---|---|---|---|---|---|
| Projections & Slices |
| ||||||||||||
| Density Histograms |


-Segmentation: #9
| File | emd_2091_msk_8.map | ||||||||||||
|---|---|---|---|---|---|---|---|---|---|---|---|---|---|
| Projections & Slices |
| ||||||||||||
| Density Histograms |


-Segmentation: #10
| File | emd_2091_msk_9.map | ||||||||||||
|---|---|---|---|---|---|---|---|---|---|---|---|---|---|
| Projections & Slices |
| ||||||||||||
| Density Histograms |


- Sample components
-Entire : Bovine mitochondrial ATP synthase
| Entire | Name: Bovine mitochondrial ATP synthase |
|---|---|
| Components |
|
-Supramolecule #1000: Bovine mitochondrial ATP synthase
| Supramolecule | Name: Bovine mitochondrial ATP synthase / type: sample / ID: 1000 Details: The sample was maintained in a buffer containing the detergent dodecylmaltoside and phospholipids Oligomeric state: One hetero oligomeric ATP synthase complex Number unique components: 1 |
|---|---|
| Molecular weight | Experimental: 600 KDa / Theoretical: 600 KDa / Method: Size exclusion |
-Macromolecule #1: ATP synthase
| Macromolecule | Name: ATP synthase / type: protein_or_peptide / ID: 1 / Name.synonym: ATPase, complex V / Number of copies: 1 / Oligomeric state: monomer / Recombinant expression: No |
|---|---|
| Source (natural) | Organism: |
| Molecular weight | Experimental: 600 KDa / Theoretical: 600 KDa |
-Experimental details
-Structure determination
| Method | cryo EM |
|---|---|
 Processing Processing | single particle reconstruction |
| Aggregation state | particle |
-Sample preparation
| Concentration | 2.5 mg/mL |
|---|---|
| Buffer | pH: 7.8 Details: 20 mM Tris-HCl, 100 mM NaCl, 2 mM MgSO4, 1 mM ATP, 0.02%[w/v] sodium azide, 0.1 % dodecylmaltoside, 0.1 mg/ml lipids (cardiolipin:PE:PC 3:1:1) |
| Grid | Details: Quantifoil R2/2 grids |
| Vitrification | Cryogen name: ETHANE / Chamber humidity: 100 % / Instrument: FEI VITROBOT MARK III / Method: Equilibrate 30 s, blot 10 s |
- Electron microscopy
| Microscope | FEI TECNAI F20 |
|---|---|
| Alignment procedure | Legacy - Astigmatism: manual astigmatism correction using image FFT |
| Date | Jan 1, 2011 |
| Image recording | Category: FILM / Film or detector model: KODAK SO-163 FILM / Digitization - Scanner: ZEISS SCAI / Digitization - Sampling interval: 7 µm / Number real images: 848 / Average electron dose: 25 e/Å2 / Bits/pixel: 8 |
| Electron beam | Acceleration voltage: 200 kV / Electron source:  FIELD EMISSION GUN FIELD EMISSION GUN |
| Electron optics | Calibrated magnification: 50000 / Illumination mode: FLOOD BEAM / Imaging mode: BRIGHT FIELD / Cs: 2.0 mm / Nominal defocus max: 7.0 µm / Nominal defocus min: 3.0 µm / Nominal magnification: 50000 |
| Sample stage | Specimen holder: Gatan 626 / Specimen holder model: GATAN LIQUID NITROGEN |
| Experimental equipment |  Model: Tecnai F20 / Image courtesy: FEI Company |
-Image processing
| CTF correction | Details: Each particle |
|---|---|
| Final reconstruction | Applied symmetry - Point group: C1 (asymmetric) / Algorithm: OTHER / Resolution.type: BY AUTHOR / Resolution: 18.0 Å / Resolution method: FSC 0.143 CUT-OFF / Software - Name: Spider, Rotan, Frealign, Build_fspace / Number images used: 57885 |
