Movie
Movie Controller

[English] 日本語
 Yorodumi
- EMDB-11826: In situ subtomogram average of the sarcomeric actin-tropomyosin f... -
+ Open data

- Basic information
| Entry | Database: EMDB / ID: EMD-11826 | |||||||||
|---|---|---|---|---|---|---|---|---|---|---|
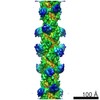
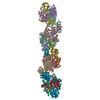
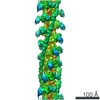
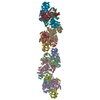
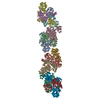
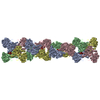
| Title | In situ subtomogram average of the sarcomeric actin-tropomyosin filament from neonatal Wistar rat cardiomyocytes in the myosin state | |||||||||
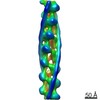
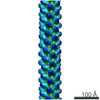
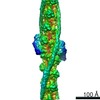
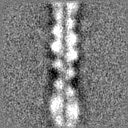
 Map data Map data | In situ subtomogram average of the sarcomeric actin filament in complex with tropomyosin in the myosin state | |||||||||
 Sample Sample |
| |||||||||
| Biological species |  | |||||||||
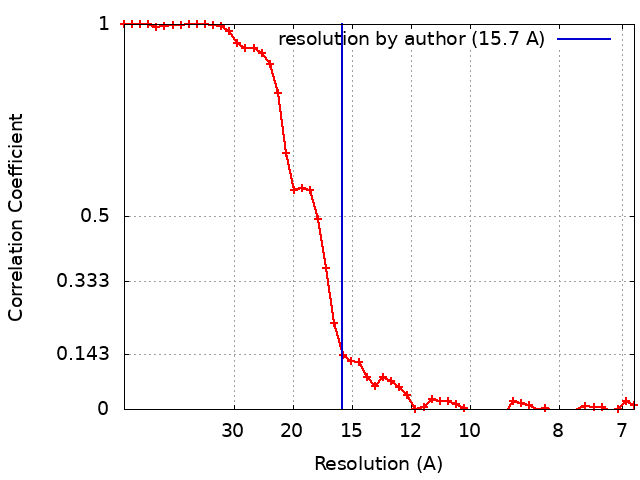
| Method | subtomogram averaging / cryo EM / Resolution: 15.7 Å | |||||||||
 Authors Authors | Schneider J / Burbaum L / Jasnin M | |||||||||
| Funding support |  Germany, 2 items Germany, 2 items
| |||||||||
 Citation Citation | Journal: Nat Commun / Year: 2021 Title: Molecular-scale visualization of sarcomere contraction within native cardiomyocytes. Authors: Laura Burbaum / Jonathan Schneider / Sarah Scholze / Ralph T Böttcher / Wolfgang Baumeister / Petra Schwille / Jürgen M Plitzko / Marion Jasnin / Abstract: Sarcomeres, the basic contractile units of striated muscle, produce the forces driving muscular contraction through cross-bridge interactions between actin-containing thin filaments and myosin II- ...Sarcomeres, the basic contractile units of striated muscle, produce the forces driving muscular contraction through cross-bridge interactions between actin-containing thin filaments and myosin II-based thick filaments. Until now, direct visualization of the molecular architecture underlying sarcomere contractility has remained elusive. Here, we use in situ cryo-electron tomography to unveil sarcomere contraction in frozen-hydrated neonatal rat cardiomyocytes. We show that the hexagonal lattice of the thick filaments is already established at the neonatal stage, with an excess of thin filaments outside the trigonal positions. Structural assessment of actin polarity by subtomogram averaging reveals that thin filaments in the fully activated state form overlapping arrays of opposite polarity in the center of the sarcomere. Our approach provides direct evidence for thin filament sliding during muscle contraction and may serve as a basis for structural understanding of thin filament activation and actomyosin interactions inside unperturbed cellular environments. | |||||||||
| History |
|
- Structure visualization
| Movie |
 Movie viewer Movie viewer |
|---|---|
| Structure viewer | EM map: SurfViewMolmilJmol/JSmol |
| Supplemental images |

- Downloads & links
-EMDB archive
| Map data | emd_11826.map.gz | 7.5 MB | EMDB map data format | |
|---|---|---|---|---|
| Header (meta data) | emd-11826-v30.xmlemd-11826.xml | 14.9 KB 14.9 KB | Display Display | EMDB header |
| FSC (resolution estimation) | emd_11826_fsc.xml | 4.5 KB | Display | FSC data file |
| Images |  emd_11826.png emd_11826.png | 34.4 KB | ||
| Masks | emd_11826_msk_1.map | 8 MB | Mask map | |
| Others | emd_11826_half_map_1.map.gzemd_11826_half_map_2.map.gz | 7.4 MB 7.4 MB | ||
| Archive directory |  http://ftp.pdbj.org/pub/emdb/structures/EMD-11826ftp://ftp.pdbj.org/pub/emdb/structures/EMD-11826 http://ftp.pdbj.org/pub/emdb/structures/EMD-11826ftp://ftp.pdbj.org/pub/emdb/structures/EMD-11826 | HTTPS FTP |
-Related structure data
| Related structure data | C: citing same article ( |
|---|---|
| Similar structure data |
-Links
| EMDB pages | EMDB (EBI/PDBe) / EMDataResource |
|---|
-Map
| File | Download / File: emd_11826.map.gz / Format: CCP4 / Size: 8 MB / Type: IMAGE STORED AS FLOATING POINT NUMBER (4 BYTES) | ||||||||||||||||||||||||||||||||||||||||||||||||||||||||||||||||||||
|---|---|---|---|---|---|---|---|---|---|---|---|---|---|---|---|---|---|---|---|---|---|---|---|---|---|---|---|---|---|---|---|---|---|---|---|---|---|---|---|---|---|---|---|---|---|---|---|---|---|---|---|---|---|---|---|---|---|---|---|---|---|---|---|---|---|---|---|---|---|
| Annotation | In situ subtomogram average of the sarcomeric actin filament in complex with tropomyosin in the myosin state | ||||||||||||||||||||||||||||||||||||||||||||||||||||||||||||||||||||
| Projections & slices | Image control
Images are generated by Spider. | ||||||||||||||||||||||||||||||||||||||||||||||||||||||||||||||||||||
| Voxel size | X=Y=Z: 3.42 Å | ||||||||||||||||||||||||||||||||||||||||||||||||||||||||||||||||||||
| Density |
| ||||||||||||||||||||||||||||||||||||||||||||||||||||||||||||||||||||
| Symmetry | Space group: 1 | ||||||||||||||||||||||||||||||||||||||||||||||||||||||||||||||||||||
| Details | EMDB XML:
CCP4 map header:
| ||||||||||||||||||||||||||||||||||||||||||||||||||||||||||||||||||||
 Z (Sec.)
 Y (Row.)
 X (Col.)


-Supplemental data
-Mask #1
| File | emd_11826_msk_1.map | ||||||||||||
|---|---|---|---|---|---|---|---|---|---|---|---|---|---|
| Projections & Slices |
| ||||||||||||
| Density Histograms |


-Half map: Halfmap 2
| File | emd_11826_half_map_1.map | ||||||||||||
|---|---|---|---|---|---|---|---|---|---|---|---|---|---|
| Annotation | Halfmap 2 | ||||||||||||
| Projections & Slices |
| ||||||||||||
| Density Histograms |


-Half map: Halfmap 1
| File | emd_11826_half_map_2.map | ||||||||||||
|---|---|---|---|---|---|---|---|---|---|---|---|---|---|
| Annotation | Halfmap 1 | ||||||||||||
| Projections & Slices |
| ||||||||||||
| Density Histograms |


- Sample components
-Entire : Sarcomeric actin-tropomyosin filament in the myosin state within ...
| Entire | Name: Sarcomeric actin-tropomyosin filament in the myosin state within the native cellular environment of neonatal Wistar rat cardiomyocytes |
|---|---|
| Components |
|
-Supramolecule #1: Sarcomeric actin-tropomyosin filament in the myosin state within ...
| Supramolecule | Name: Sarcomeric actin-tropomyosin filament in the myosin state within the native cellular environment of neonatal Wistar rat cardiomyocytes type: complex / ID: 1 / Parent: 0 / Macromolecule list: #1 |
|---|---|
| Source (natural) | Organism: |
-Experimental details
-Structure determination
| Method | cryo EM |
|---|---|
 Processing Processing | subtomogram averaging |
| Aggregation state | cell |
-Sample preparation
| Buffer | pH: 7.4 |
|---|---|
| Vitrification | Cryogen name: ETHANE-PROPANE |
- Electron microscopy
| Microscope | FEI TITAN KRIOS |
|---|---|
| Image recording | Film or detector model: GATAN K2 SUMMIT (4k x 4k) / Detector mode: COUNTING / Average electron dose: 120.0 e/Å2 |
| Electron beam | Acceleration voltage: 300 kV / Electron source:  FIELD EMISSION GUN FIELD EMISSION GUN |
| Electron optics | Calibrated magnification: 42000 / Illumination mode: FLOOD BEAM / Imaging mode: BRIGHT FIELD / Cs: 2.7 mm |
| Experimental equipment |  Model: Titan Krios / Image courtesy: FEI Company |