 Movie
Movie Controller

[English] 日本語
 Yorodumi
- EMDB-26974: Local refinement of RhAG/CE trimer in class 2 of erythrocyte anky... -
+ Open data

- Basic information
| Entry |  | |||||||||
|---|---|---|---|---|---|---|---|---|---|---|
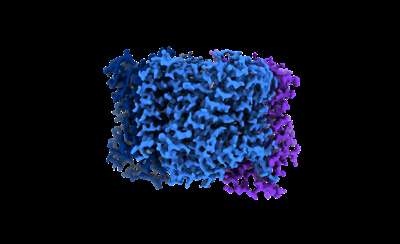
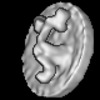
| Title | Local refinement of RhAG/CE trimer in class 2 of erythrocyte ankyrin-1 complex | |||||||||
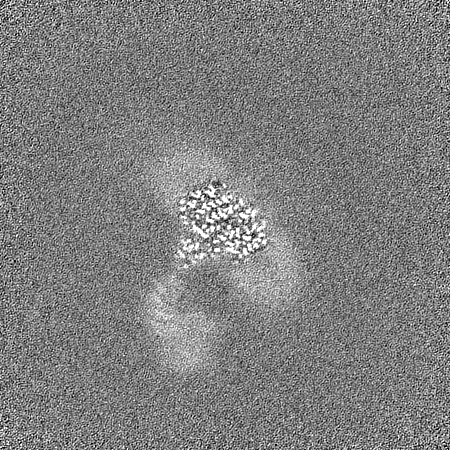
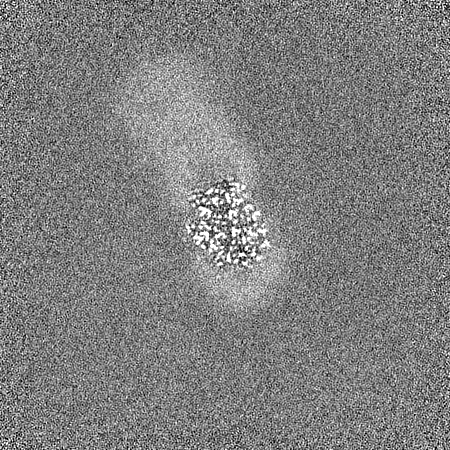
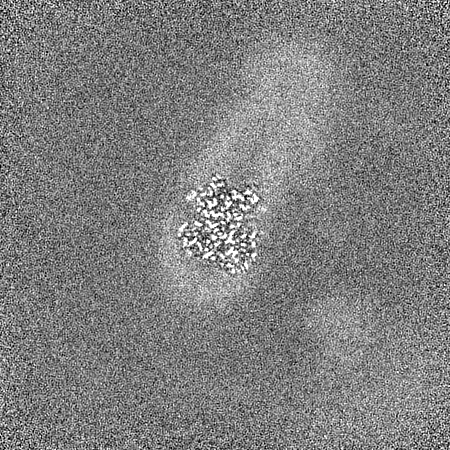
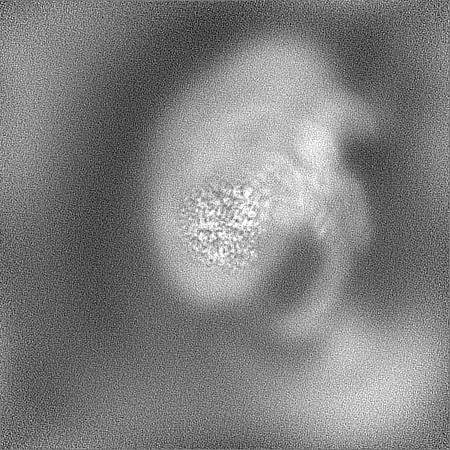
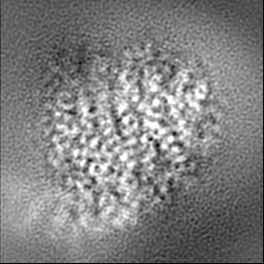
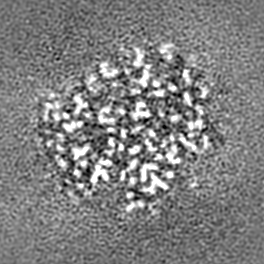
 Map data Map data | Main map used for model fitting. Density modified and cropped using phenix.resolve_cryo_em, resampled on fine grid using relion_image_handler. | |||||||||
 Sample Sample |
| |||||||||
 Keywords Keywords | Membrane Protein / Anion Exchange / Erythrocyte / Glycoprotein / TRANSPORT PROTEIN-STRUCTURAL PROTEIN complex | |||||||||
| Function / homology |  Function and homology information Function and homology informationmethylammonium transmembrane transport / Defective RHAG causes regulator type Rh-null hemolytic anemia (RHN) / Rhesus blood group biosynthesis / methylammonium transmembrane transporter activity / Rhesus glycoproteins mediate ammonium transport / carbon dioxide transmembrane transport / carbon dioxide transmembrane transporter activity / ammonium homeostasis / leak channel activity / ankyrin-1 complex ...methylammonium transmembrane transport / Defective RHAG causes regulator type Rh-null hemolytic anemia (RHN) / Rhesus blood group biosynthesis / methylammonium transmembrane transporter activity / Rhesus glycoproteins mediate ammonium transport / carbon dioxide transmembrane transport / carbon dioxide transmembrane transporter activity / ammonium homeostasis / leak channel activity / ankyrin-1 complex / ammonium transmembrane transport / intracellular monoatomic ion homeostasis / ammonium channel activity / bicarbonate transport / : / ankyrin binding / erythrocyte development / carbon dioxide transport / Erythrocytes take up oxygen and release carbon dioxide / Erythrocytes take up carbon dioxide and release oxygen / multicellular organismal-level iron ion homeostasis / membrane / plasma membrane Similarity search - Function | |||||||||
| Biological species |  Homo sapiens (human) Homo sapiens (human) | |||||||||
| Method | single particle reconstruction / cryo EM / Resolution: 2.4 Å | |||||||||
 Authors Authors | Vallese F / Kim K / Yen LY / Johnston JD / Noble AJ / Cali T / Clarke OB | |||||||||
| Funding support | 1 items
| |||||||||
 Citation Citation | Journal: Nat Struct Mol Biol / Year: 2022 Title: Architecture of the human erythrocyte ankyrin-1 complex. Authors: Francesca Vallese / Kookjoo Kim / Laura Y Yen / Jake D Johnston / Alex J Noble / Tito Calì / Oliver Biggs Clarke /   Abstract: The stability and shape of the erythrocyte membrane is provided by the ankyrin-1 complex, but how it tethers the spectrin-actin cytoskeleton to the lipid bilayer and the nature of its association ...The stability and shape of the erythrocyte membrane is provided by the ankyrin-1 complex, but how it tethers the spectrin-actin cytoskeleton to the lipid bilayer and the nature of its association with the band 3 anion exchanger and the Rhesus glycoproteins remains unknown. Here we present structures of ankyrin-1 complexes purified from human erythrocytes. We reveal the architecture of a core complex of ankyrin-1, the Rhesus proteins RhAG and RhCE, the band 3 anion exchanger, protein 4.2, glycophorin A and glycophorin B. The distinct T-shaped conformation of membrane-bound ankyrin-1 facilitates recognition of RhCE and, unexpectedly, the water channel aquaporin-1. Together, our results uncover the molecular details of ankyrin-1 association with the erythrocyte membrane, and illustrate the mechanism of ankyrin-mediated membrane protein clustering. | |||||||||
| History |
|
- Structure visualization
| Supplemental images |
|---|
- Downloads & links
-EMDB archive
| Map data | emd_26974.map.gz | 65.3 MB | EMDB map data format | |
|---|---|---|---|---|
| Header (meta data) | emd-26974-v30.xmlemd-26974.xml | 36.3 KB 36.3 KB | Display Display | EMDB header |
| FSC (resolution estimation) | emd_26974_fsc.xml | 15.9 KB | Display | FSC data file |
| Images |  emd_26974.png emd_26974.png | 57.9 KB | ||
| Filedesc metadata | emd-26974.cif.gz | 7.3 KB | ||
| Others | emd_26974_additional_1.map.gzemd_26974_additional_2.map.gzemd_26974_additional_3.map.gzemd_26974_additional_4.map.gzemd_26974_half_map_1.map.gzemd_26974_half_map_2.map.gz | 322.5 MB 322.5 MB 328 MB 595.7 KB 64.4 MB 64.4 MB | ||
| Archive directory |  http://ftp.pdbj.org/pub/emdb/structures/EMD-26974ftp://ftp.pdbj.org/pub/emdb/structures/EMD-26974 http://ftp.pdbj.org/pub/emdb/structures/EMD-26974ftp://ftp.pdbj.org/pub/emdb/structures/EMD-26974 | HTTPS FTP |
-Related structure data
| Related structure data |  8csxMC  7uz3C  7uzeC  7uzqC  7uzsC  7uzuC  7uzvC  7v07C  7v0kC  7v0mC  7v0qC  7v0sC  7v0tC  7v0uC 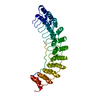 7v0xC  7v0yC  7v19C  8crqC  8crrC  8crtC  8cs9C  8cslC 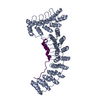 8csvC  8cswC  8csyC  8ct2C  8ct3C  8cteC C: citing same article ( M: atomic model generated by this map |
|---|---|
| Similar structure data |


-Links
| EMDB pages | EMDB (EBI/PDBe) / EMDataResource |
|---|
-Map
| File | Download / File: emd_26974.map.gz / Format: CCP4 / Size: 70.2 MB / Type: IMAGE STORED AS FLOATING POINT NUMBER (4 BYTES) | ||||||||||||||||||||||||||||||||||||
|---|---|---|---|---|---|---|---|---|---|---|---|---|---|---|---|---|---|---|---|---|---|---|---|---|---|---|---|---|---|---|---|---|---|---|---|---|---|
| Annotation | Main map used for model fitting. Density modified and cropped using phenix.resolve_cryo_em, resampled on fine grid using relion_image_handler. | ||||||||||||||||||||||||||||||||||||
| Projections & slices | Image control
Images are generated by Spider. | ||||||||||||||||||||||||||||||||||||
| Voxel size | X=Y=Z: 0.415 Å | ||||||||||||||||||||||||||||||||||||
| Density |
| ||||||||||||||||||||||||||||||||||||
| Symmetry | Space group: 1 | ||||||||||||||||||||||||||||||||||||
| Details | EMDB XML:
|
 Z (Sec.)
 Y (Row.)
 X (Col.)


-Supplemental data
-Additional map: Half map 1 (unmodified)
| File | emd_26974_additional_1.map | ||||||||||||
|---|---|---|---|---|---|---|---|---|---|---|---|---|---|
| Annotation | Half map 1 (unmodified) | ||||||||||||
| Projections & Slices |
| ||||||||||||
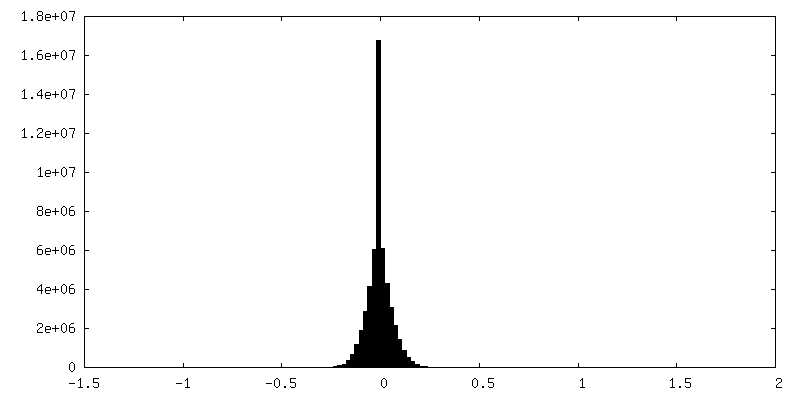
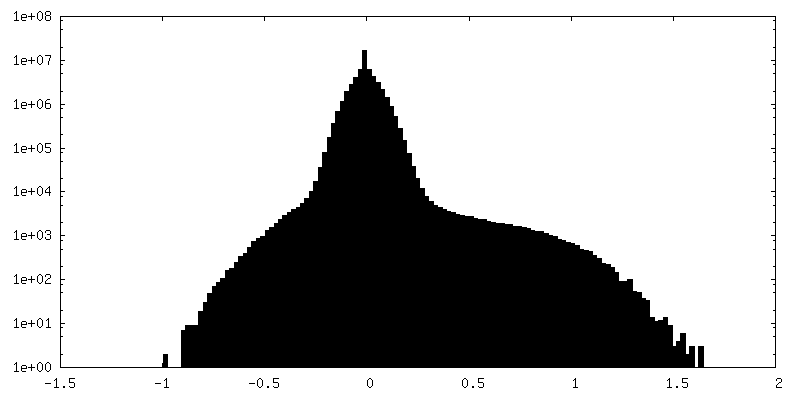
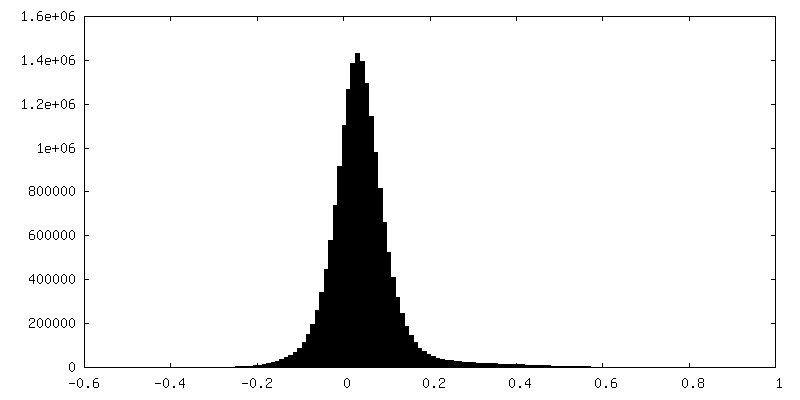
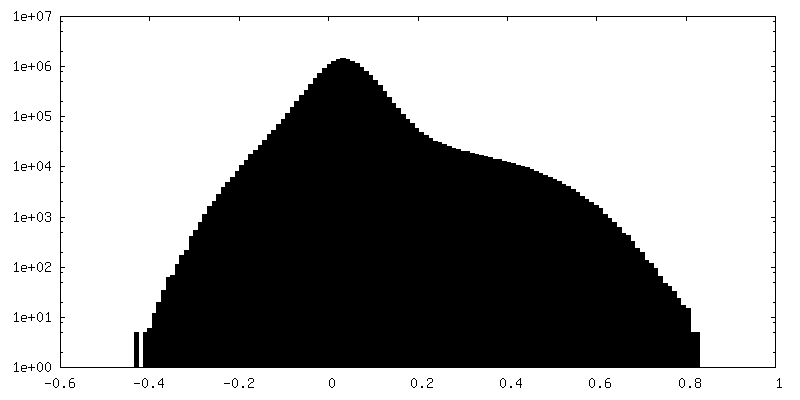
| Density Histograms |


-Additional map: Half map 2 (unmodified)
| File | emd_26974_additional_2.map | ||||||||||||
|---|---|---|---|---|---|---|---|---|---|---|---|---|---|
| Annotation | Half map 2 (unmodified) | ||||||||||||
| Projections & Slices |
| ||||||||||||
| Density Histograms |


-Additional map: B-factor sharpened map
| File | emd_26974_additional_3.map | ||||||||||||
|---|---|---|---|---|---|---|---|---|---|---|---|---|---|
| Annotation | B-factor sharpened map | ||||||||||||
| Projections & Slices |
| ||||||||||||
| Density Histograms |


-Additional map: Mask used for FSC calculation
| File | emd_26974_additional_4.map | ||||||||||||
|---|---|---|---|---|---|---|---|---|---|---|---|---|---|
| Annotation | Mask used for FSC calculation | ||||||||||||
| Projections & Slices |
| ||||||||||||
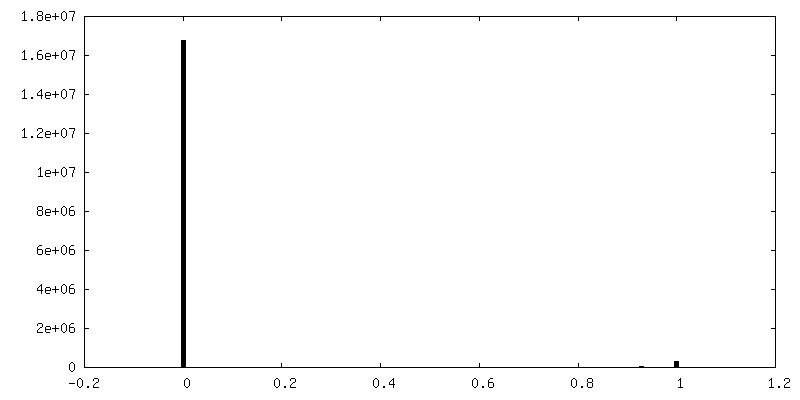
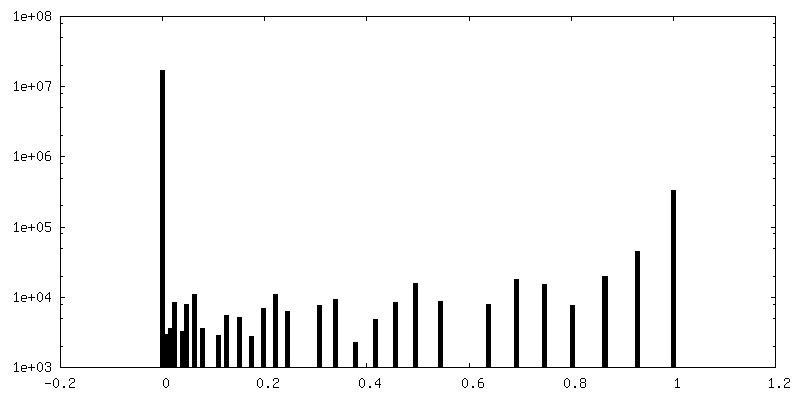
| Density Histograms |


-Half map: Half map 1 (cropped and resampled to match main map)
| File | emd_26974_half_map_1.map | ||||||||||||
|---|---|---|---|---|---|---|---|---|---|---|---|---|---|
| Annotation | Half map 1 (cropped and resampled to match main map) | ||||||||||||
| Projections & Slices |
| ||||||||||||
| Density Histograms |


-Half map: Half map 2 (cropped and resampled to match main map)
| File | emd_26974_half_map_2.map | ||||||||||||
|---|---|---|---|---|---|---|---|---|---|---|---|---|---|
| Annotation | Half map 2 (cropped and resampled to match main map) | ||||||||||||
| Projections & Slices |
| ||||||||||||
| Density Histograms |


- Sample components
-Entire : Class 1 of erythrocyte ankyrin complex (composite map)
| Entire | Name: Class 1 of erythrocyte ankyrin complex (composite map) |
|---|---|
| Components |
|
-Supramolecule #1: Class 1 of erythrocyte ankyrin complex (composite map)
| Supramolecule | Name: Class 1 of erythrocyte ankyrin complex (composite map) type: complex / ID: 1 / Parent: 0 / Macromolecule list: #1-#2 |
|---|---|
| Source (natural) | Organism: Homo sapiens (human) |
-Macromolecule #1: Blood group Rh(CE) polypeptide
| Macromolecule | Name: Blood group Rh(CE) polypeptide / type: protein_or_peptide / ID: 1 / Number of copies: 1 / Enantiomer: LEVO |
|---|---|
| Source (natural) | Organism: Homo sapiens (human) |
| Molecular weight | Theoretical: 45.598918 KDa |
| Sequence | String: MSSKYPRSVR RCLPLWALTL EAALILLFYF FTHYDASLED QKGLVASYQV GQDLTVMAAL GLGFLTSNFR RHSWSSVAFN LFMLALGVQ WAILLDGFLS QFPPGKVVIT LFSIRLATMS AMSVLISAGA VLGKVNLAQL VVMVLVEVTA LGTLRMVISN I FNTDYHMN ...String: MSSKYPRSVR RCLPLWALTL EAALILLFYF FTHYDASLED QKGLVASYQV GQDLTVMAAL GLGFLTSNFR RHSWSSVAFN LFMLALGVQ WAILLDGFLS QFPPGKVVIT LFSIRLATMS AMSVLISAGA VLGKVNLAQL VVMVLVEVTA LGTLRMVISN I FNTDYHMN LRHFYVFAAY FGLTVAWCLP KPLPKGTEDN DQRATIPSLS AMLGALFLWM FWPSVNSPLL RSPIQRKNAM FN TYYALAV SVVTAISGSS LAHPQRKISM TYVHSAVLAG GVAVGTSCHL IPSPWLAMVL GLVAGLISIG GAKCLPVCCN RVL GIHHIS VMHSIFSLLG LLGEITYIVL LVLHTVWNGN GMIGFQVLLS IGELSLAIVI ALTSGLLTGL LLNLKIWKAP HVAK YFDDQ VFWKFPHLAV GF UniProtKB: Blood group Rh(CE) polypeptide |
-Macromolecule #2: Ammonium transporter Rh type A
| Macromolecule | Name: Ammonium transporter Rh type A / type: protein_or_peptide / ID: 2 / Number of copies: 2 / Enantiomer: LEVO |
|---|---|
| Source (natural) | Organism: Homo sapiens (human) |
| Molecular weight | Theoretical: 44.229629 KDa |
| Sequence | String: MRFTFPLMAI VLEIAMIVLF GLFVEYETDQ TVLEQLNITK PTDMGIFFEL YPLFQDVHVM IFVGFGFLMT FLKKYGFSSV GINLLVAAL GLQWGTIVQG ILQSQGQKFN IGIKNMINAD FSAATVLISF GAVLGKTSPT QMLIMTILEI VFFAHNEYLV S EIFKASDI ...String: MRFTFPLMAI VLEIAMIVLF GLFVEYETDQ TVLEQLNITK PTDMGIFFEL YPLFQDVHVM IFVGFGFLMT FLKKYGFSSV GINLLVAAL GLQWGTIVQG ILQSQGQKFN IGIKNMINAD FSAATVLISF GAVLGKTSPT QMLIMTILEI VFFAHNEYLV S EIFKASDI GASMTIHAFG AYFGLAVAGI LYRSGLRKGH ENEESAYYSD LFAMIGTLFL WMFWPSFNSA IAEPGDKQCR AI VNTYFSL AACVLTAFAF SSLVEHRGKL NMVHIQNATL AGGVAVGTCA DMAIHPFGSM IIGSIAGMVS VLGYKFLTPL FTT KLRIHD TCGVHNLHGL PGVVGGLAGI VAVAMGASNT SMAMQAAALG SSIGTAVVGG LMTGLILKLP LWGQPSDQNC YDDS VYWKV PKTR UniProtKB: Ammonium transporter Rh type A |
-Macromolecule #3: CHOLESTEROL
| Macromolecule | Name: CHOLESTEROL / type: ligand / ID: 3 / Number of copies: 2 / Formula: CLR |
|---|---|
| Molecular weight | Theoretical: 386.654 Da |
| Chemical component information |  ChemComp-CLR: |
-Macromolecule #4: Digitonin
| Macromolecule | Name: Digitonin / type: ligand / ID: 4 / Number of copies: 2 / Formula: AJP |
|---|---|
| Molecular weight | Theoretical: 1.229312 KDa |
| Chemical component information |  ChemComp-AJP: |
-Macromolecule #5: water
| Macromolecule | Name: water / type: ligand / ID: 5 / Number of copies: 150 / Formula: HOH |
|---|---|
| Molecular weight | Theoretical: 18.015 Da |
| Chemical component information |  ChemComp-HOH: |
-Experimental details
-Structure determination
| Method | cryo EM |
|---|---|
 Processing Processing | single particle reconstruction |
| Aggregation state | particle |
-Sample preparation
| Concentration | 8 mg/mL |
|---|---|
| Buffer | pH: 7.4 Details: Final gel filtration buffer contained 0.05% w/v digitonin, 130 mM KCl, 20 mM HEPES, pH 7.4, 1 mM ATP, 1 mM MgCl2, 1 mM PMSF. Peak fractions were concentrated to 8 mg/mL, and 0.01% w/v ...Details: Final gel filtration buffer contained 0.05% w/v digitonin, 130 mM KCl, 20 mM HEPES, pH 7.4, 1 mM ATP, 1 mM MgCl2, 1 mM PMSF. Peak fractions were concentrated to 8 mg/mL, and 0.01% w/v glycyrrhizic acid was added immediately prior to vitrification. |
| Vitrification | Cryogen name: ETHANE / Chamber humidity: 100 % / Chamber temperature: 277 K / Instrument: FEI VITROBOT MARK IV / Details: 4-6 seconds, wait time 30 seconds. |
| Details | Ankyrin complex mixture purified from digitonin-solubilized erythrocyte ghost membranes |
- Electron microscopy
| Microscope | FEI TITAN KRIOS |
|---|---|
| Specialist optics | Energy filter - Name: GIF Bioquantum / Energy filter - Slit width: 20 eV |
| Image recording | Film or detector model: GATAN K3 (6k x 4k) / Number grids imaged: 2 / Number real images: 14464 / Average exposure time: 2.5 sec. / Average electron dose: 58.0 e/Å2 / Details: Two grids were imaged in a single session. |
| Electron beam | Acceleration voltage: 300 kV / Electron source:  FIELD EMISSION GUN FIELD EMISSION GUN |
| Electron optics | Illumination mode: FLOOD BEAM / Imaging mode: BRIGHT FIELD / Cs: 2.7 mm / Nominal defocus max: 1.5 µm / Nominal defocus min: 0.5 µm |
| Sample stage | Specimen holder model: FEI TITAN KRIOS AUTOGRID HOLDER / Cooling holder cryogen: NITROGEN |
| Experimental equipment |  Model: Titan Krios / Image courtesy: FEI Company |

