 ムービー
ムービー コントローラー


+ データを開く

- 基本情報
基本情報
| 登録情報 | データベース: PDB / ID: 3j7h | ||||||
|---|---|---|---|---|---|---|---|
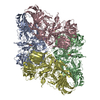
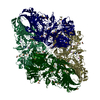
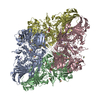
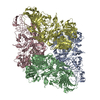
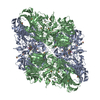
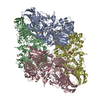
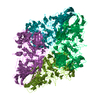
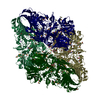
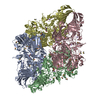
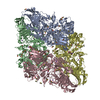
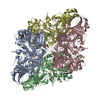
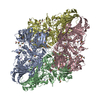
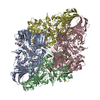
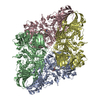
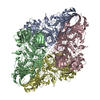
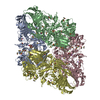
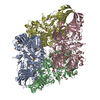
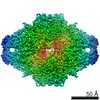
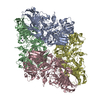
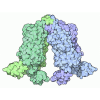
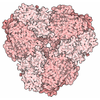
| タイトル | Structure of beta-galactosidase at 3.2-A resolution obtained by cryo-electron microscopy | ||||||
 要素 要素 | Beta-galactosidase | ||||||
 キーワード キーワード | HYDROLASE / hydrolase enzyme / homo-tetramer / protein complex / atomic resolution cryo-electron microscopy / direct electron detectors / single-particle cryo-EM / 3D reconstruction | ||||||
| 機能・相同性 |  機能・相同性情報 機能・相同性情報alkali metal ion binding / lactose catabolic process / beta-galactosidase complex / beta-galactosidase / beta-galactosidase activity / carbohydrate binding / magnesium ion binding / identical protein binding 類似検索 - 分子機能 | ||||||
| 生物種 |  | ||||||
| 手法 | 電子顕微鏡法 / 単粒子再構成法 / クライオ電子顕微鏡法 / 解像度: 3.2 Å | ||||||
 データ登録者 データ登録者 | Bartesaghi, A. / Matthies, D. / Banerjee, S. / Merk, A. / Subramaniam, S. | ||||||
 引用 引用 | ジャーナル: Proc Natl Acad Sci U S A / 年: 2014 タイトル: Structure of β-galactosidase at 3.2-Å resolution obtained by cryo-electron microscopy. 著者: Alberto Bartesaghi / Doreen Matthies / Soojay Banerjee / Alan Merk / Sriram Subramaniam /  要旨: We report the solution structure of Escherichia coli β-galactosidase (∼465 kDa), solved at ∼3.2-Å resolution by using single-particle cryo-electron microscopy (cryo-EM). Densities for most side ...We report the solution structure of Escherichia coli β-galactosidase (∼465 kDa), solved at ∼3.2-Å resolution by using single-particle cryo-electron microscopy (cryo-EM). Densities for most side chains, including those of residues in the active site, and a catalytic Mg(2+) ion can be discerned in the map obtained by cryo-EM. The atomic model derived from our cryo-EM analysis closely matches the 1.7-Å crystal structure with a global rmsd of ∼0.66 Å. There are significant local differences throughout the protein, with clear evidence for conformational changes resulting from contact zones in the crystal lattice. Inspection of the map reveals that although densities for residues with positively charged and neutral side chains are well resolved, systematically weaker densities are observed for residues with negatively charged side chains. We show that the weaker densities for negatively charged residues arise from their greater sensitivity to radiation damage from electron irradiation as determined by comparison of density maps obtained by using electron doses ranging from 10 to 30 e(-)/Å(2). In summary, we establish that it is feasible to use cryo-EM to determine near-atomic resolution structures of protein complexes (<500 kDa) with low symmetry, and that the residue-specific radiation damage that occurs with increasing electron dose can be monitored by using dose fractionation tools available with direct electron detector technology. | ||||||
| 履歴 |
|
- 構造の表示
構造の表示
| ムービー |
ムービービューア |
|---|---|
| 構造ビューア | 分子: MolmilJmol/JSmol |
- ダウンロードとリンク
-ダウンロード
| PDBx/mmCIF形式 | 3j7h.cif.gz | 795.9 KB | 表示 | PDBx/mmCIF形式 |
|---|---|---|---|---|
| PDB形式 | pdb3j7h.ent.gz | 640.2 KB | 表示 | PDB形式 |
| PDBx/mmJSON形式 | 3j7h.json.gz | ツリー表示 | PDBx/mmJSON形式 | |
| その他 |  その他のダウンロード その他のダウンロード |
-検証レポート
| アーカイブディレクトリ | https://data.pdbj.org/pub/pdb/validation_reports/j7/3j7hftp://data.pdbj.org/pub/pdb/validation_reports/j7/3j7h | HTTPS FTP |
|---|
-関連構造データ
| 関連構造データ |  5995MC M: このデータのモデリングに利用したマップデータ C: 同じ文献を引用 ( |
|---|---|
| 類似構造データ | |
| 電子顕微鏡画像生データ | EMPIAR-10012 (タイトル: Structure of β-galactosidase at 3.2-Å resolution obtained by cryo-electron microscopy (frame-averaged micrographs) Data size: 108.0 Data #1: Beta Galactosidase micrographs [micrographs - single frame]) EMPIAR-10013 (タイトル: Structure of β-galactosidase at 3.2-Å resolution obtained by cryo-electron microscopyData size: 442.5 Data #1: Full set of multi-frame micrographs [micrographs - multiframe] Data #2: Sample set of multi-frame micrographs [micrographs - multiframe]) |

-リンク
 PDBj
PDBj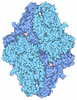
- 集合体
集合体
| 登録構造単位 | 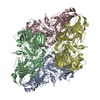
|
|---|---|
| 1 |
|
-要素
| #1: タンパク質 | 分子量: 116602.484 Da / 分子数: 4 / 由来タイプ: 天然 / 由来: (天然) #2: 化合物 | ChemComp-MG /   分子量: 24.305 Da / 分子数: 4 / 由来タイプ: 合成 / 式: Mg 分子量: 24.305 Da / 分子数: 4 / 由来タイプ: 合成 / 式: Mg |
|---|
-実験情報
-実験
| 実験 | 手法: 電子顕微鏡法 |
|---|---|
| EM実験 | 試料の集合状態: PARTICLE / 3次元再構成法: 単粒子再構成法 |
- 試料調製
試料調製
| 構成要素 | 名称: Escherichia coli beta-galactosidase / タイプ: COMPLEX / 詳細: tetramer |
|---|---|
| 分子量 | 値: 0.465 MDa / 実験値: NO |
| 緩衝液 | 名称: 25 mM Tris, pH 8.0, 50 mM NaCl, 2 mM MgCl2, 0.5 mM TCEP pH: 8 詳細: 25 mM Tris, pH 8.0, 50 mM NaCl, 2 mM MgCl2, 0.5 mM TCEP |
| 試料 | 濃度: 2.3 mg/ml / 包埋: NO / シャドウイング: NO / 染色: NO / 凍結: YES |
| 試料支持 | 詳細: 200 mesh Quantifoil R2/2 grids, plasma cleaned |
| 急速凍結 | 装置: LEICA EM GP / 凍結剤: ETHANE / Temp: 90.15 K / 湿度: 90 % 詳細: Blot for 2 seconds before plunging into liquid ethane (LEICA EM GP). 手法: Blot for 2 seconds before plunging. |
- 電子顕微鏡撮影
| 実験機器 |  モデル: Titan Krios / 画像提供: FEI Company |
|---|---|
| 顕微鏡 | モデル: FEI TITAN KRIOS / 日付: 2013年10月31日 / 詳細: Parallel beam illumination |
| 電子銃 | 電子線源:  FIELD EMISSION GUN / 加速電圧: 300 kV / 照射モード: FLOOD BEAM / Electron beam tilt params: 5 FIELD EMISSION GUN / 加速電圧: 300 kV / 照射モード: FLOOD BEAM / Electron beam tilt params: 5 |
| 電子レンズ | モード: BRIGHT FIELD / 倍率(公称値): 105000 X / 倍率(補正後): 105000 X / 最大 デフォーカス(公称値): 2500 nm / 最小 デフォーカス(公称値): 1000 nm / Cs: 2.7 mm 非点収差: Objective lens astigmatism was corrected at 105,000 times magnification. カメラ長: 0 mm |
| 試料ホルダ | 試料ホルダーモデル: FEI TITAN KRIOS AUTOGRID HOLDER 資料ホルダタイプ: Liquid nitrogen cooled / 温度: 79.7 K / 最高温度: 79.8 K / 最低温度: 79.6 K / 傾斜角・最大: 0 ° / 傾斜角・最小: 0 ° |
| 撮影 | 電子線照射量: 45 e/Å2 / フィルム・検出器のモデル: GATAN K2 (4k x 4k) |
| 電子光学装置 | エネルギーフィルター名称: GIF / エネルギーフィルター 上限: 20 eV / エネルギーフィルター 下限: 0 eV |
| 画像スキャン | デジタル画像の数: 509 |
| 放射 | プロトコル: SINGLE WAVELENGTH / 単色(M)・ラウエ(L): M / 散乱光タイプ: x-ray |
| 放射波長 | 相対比: 1 |
- 解析
解析
| EMソフトウェア |
| ||||||||||||||||||||
|---|---|---|---|---|---|---|---|---|---|---|---|---|---|---|---|---|---|---|---|---|---|
| CTF補正 | 詳細: Individual frames of each movie were aligned by cross-correlation using the cumulative average of previously aligned frames as a reference to align the remaining frames. Parameters of the ...詳細: Individual frames of each movie were aligned by cross-correlation using the cumulative average of previously aligned frames as a reference to align the remaining frames. Parameters of the contrast transfer function for each micrograph were estimated from power spectra obtained using periodogram averaging with tiles of size 512x512 pixels extracted from all frames of each movie. These power spectra were then radially averaged and used to estimate the defocus for each image using frequencies in the 15.0-3.0 Angstrom range. CTF correction was done for each particle as implemented in FREALIGN's reconstruction protocol. | ||||||||||||||||||||
| 対称性 | 点対称性: D2 (2回x2回 2面回転対称) | ||||||||||||||||||||
| 3次元再構成 | 手法: phase residual minimization / 解像度: 3.2 Å / 解像度の算出法: FSC 0.143 CUT-OFF / 粒子像の数: 11726 / ピクセルサイズ(公称値): 0.6375 Å / ピクセルサイズ(実測値): 0.6375 Å 詳細: Reconstruction details: 24,750 particles were picked automatically from the best 509 micrographs by detecting the local maxima of correlation of each image with a Gaussian disk of 100 ...詳細: Reconstruction details: 24,750 particles were picked automatically from the best 509 micrographs by detecting the local maxima of correlation of each image with a Gaussian disk of 100 Angstrom in radius and extracted using a binning factor of 2 and a box size of 384x384 pixels. Particles were then subjected to reference-free 2D classification in EMAN2. 160 classes out of a total of 250 were used for de novo initial model determination using e2initialmodel.py and imposing D2 symmetry. A subset of 23,452 particles (corresponding to the 160 classes used for the initial model building) was then used for 3D refinement using a gold-standard approach. Two stacks of 11,726 particles each were independently subjected to eight rounds of iterative refinement in FREALIGN using a high-resolution frequency limit of 8 Angstrom and using the best 50% of particles from each stack according to phase residual values (equivalent to 5,863 particles) to calculate the reconstructions at each iteration. At this point particles were re-extracted from the original unbinned micrographs using a box size of 768x768 pixels and further refined in FREALIGN starting from the most recent set of alignments obtained with the binned data. The final map was obtained by averaging the two half-reconstructions in real space and corrected by a B-factor of -85 Angstrom^2 for the purpose of visualization. Refinement type: HALF-MAPS REFINED INDEPENDENTLY / 対称性のタイプ: POINT | ||||||||||||||||||||
| 原子モデル構築 | プロトコル: FLEXIBLE FIT / 空間: REAL 詳細: METHOD--Local refinement, Flexible fitting DETAILS--Initial local fitting was done using Chimera and then COOT was used for flexible fitting and model building. | ||||||||||||||||||||
| 精密化ステップ | サイクル: LAST
|
