 Movie
Movie Controller

[English] 日本語
 Yorodumi
- PDB-3j7h: Structure of beta-galactosidase at 3.2-A resolution obtained by c... -
+ Open data

- Basic information
| Entry | Database: PDB / ID: 3j7h | ||||||
|---|---|---|---|---|---|---|---|
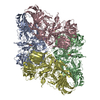
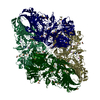
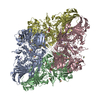
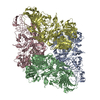
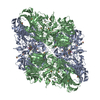
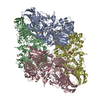
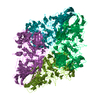
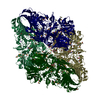
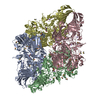
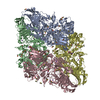
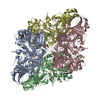
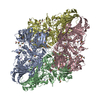
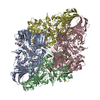
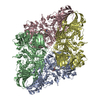
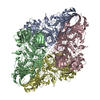
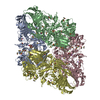
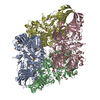
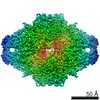
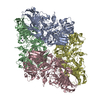
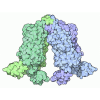
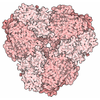
| Title | Structure of beta-galactosidase at 3.2-A resolution obtained by cryo-electron microscopy | ||||||
 Components Components | Beta-galactosidase | ||||||
 Keywords Keywords | HYDROLASE / hydrolase enzyme / homo-tetramer / protein complex / atomic resolution cryo-electron microscopy / direct electron detectors / single-particle cryo-EM / 3D reconstruction | ||||||
| Function / homology |  Function and homology information Function and homology informationalkali metal ion binding / lactose catabolic process / beta-galactosidase complex / beta-galactosidase / beta-galactosidase activity / carbohydrate binding / magnesium ion binding / identical protein binding Similarity search - Function | ||||||
| Biological species |  | ||||||
| Method | ELECTRON MICROSCOPY / single particle reconstruction / cryo EM / Resolution: 3.2 Å | ||||||
 Authors Authors | Bartesaghi, A. / Matthies, D. / Banerjee, S. / Merk, A. / Subramaniam, S. | ||||||
 Citation Citation | Journal: Proc Natl Acad Sci U S A / Year: 2014 Title: Structure of β-galactosidase at 3.2-Å resolution obtained by cryo-electron microscopy. Authors: Alberto Bartesaghi / Doreen Matthies / Soojay Banerjee / Alan Merk / Sriram Subramaniam /  Abstract: We report the solution structure of Escherichia coli β-galactosidase (∼465 kDa), solved at ∼3.2-Å resolution by using single-particle cryo-electron microscopy (cryo-EM). Densities for most side ...We report the solution structure of Escherichia coli β-galactosidase (∼465 kDa), solved at ∼3.2-Å resolution by using single-particle cryo-electron microscopy (cryo-EM). Densities for most side chains, including those of residues in the active site, and a catalytic Mg(2+) ion can be discerned in the map obtained by cryo-EM. The atomic model derived from our cryo-EM analysis closely matches the 1.7-Å crystal structure with a global rmsd of ∼0.66 Å. There are significant local differences throughout the protein, with clear evidence for conformational changes resulting from contact zones in the crystal lattice. Inspection of the map reveals that although densities for residues with positively charged and neutral side chains are well resolved, systematically weaker densities are observed for residues with negatively charged side chains. We show that the weaker densities for negatively charged residues arise from their greater sensitivity to radiation damage from electron irradiation as determined by comparison of density maps obtained by using electron doses ranging from 10 to 30 e(-)/Å(2). In summary, we establish that it is feasible to use cryo-EM to determine near-atomic resolution structures of protein complexes (<500 kDa) with low symmetry, and that the residue-specific radiation damage that occurs with increasing electron dose can be monitored by using dose fractionation tools available with direct electron detector technology. | ||||||
| History |
|
- Structure visualization
| Movie |
Movie viewer |
|---|---|
| Structure viewer | Molecule: MolmilJmol/JSmol |
- Downloads & links
-Download
| PDBx/mmCIF format | 3j7h.cif.gz | 795.9 KB | Display | PDBx/mmCIF format |
|---|---|---|---|---|
| PDB format | pdb3j7h.ent.gz | 640.2 KB | Display | PDB format |
| PDBx/mmJSON format | 3j7h.json.gz | Tree view | PDBx/mmJSON format | |
| Others |  Other downloads Other downloads |
-Validation report
| Arichive directory | https://data.pdbj.org/pub/pdb/validation_reports/j7/3j7hftp://data.pdbj.org/pub/pdb/validation_reports/j7/3j7h | HTTPS FTP |
|---|
-Related structure data
| Related structure data |  5995MC M: map data used to model this data C: citing same article ( |
|---|---|
| Similar structure data | |
| EM raw data | EMPIAR-10012 (Title: Structure of β-galactosidase at 3.2-Å resolution obtained by cryo-electron microscopy (frame-averaged micrographs) Data size: 108.0 Data #1: Beta Galactosidase micrographs [micrographs - single frame]) EMPIAR-10013 (Title: Structure of β-galactosidase at 3.2-Å resolution obtained by cryo-electron microscopyData size: 442.5 Data #1: Full set of multi-frame micrographs [micrographs - multiframe] Data #2: Sample set of multi-frame micrographs [micrographs - multiframe]) |

-Links
 PDBj
PDBj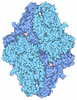
- Assembly
| Deposited unit | 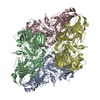
|
|---|---|
| 1 |
|
-Components
| #1: Protein | Mass: 116602.484 Da / Num. of mol.: 4 / Source method: isolated from a natural source / Source: (natural) #2: Chemical | ChemComp-MG /   Mass: 24.305 Da / Num. of mol.: 4 / Source method: obtained synthetically / Formula: Mg Mass: 24.305 Da / Num. of mol.: 4 / Source method: obtained synthetically / Formula: Mg |
|---|
-Experimental details
-Experiment
| Experiment | Method: ELECTRON MICROSCOPY |
|---|---|
| EM experiment | Aggregation state: PARTICLE / 3D reconstruction method: single particle reconstruction |
- Sample preparation
| Component | Name: Escherichia coli beta-galactosidase / Type: COMPLEX / Details: tetramer |
|---|---|
| Molecular weight | Value: 0.465 MDa / Experimental value: NO |
| Buffer solution | Name: 25 mM Tris, pH 8.0, 50 mM NaCl, 2 mM MgCl2, 0.5 mM TCEP pH: 8 Details: 25 mM Tris, pH 8.0, 50 mM NaCl, 2 mM MgCl2, 0.5 mM TCEP |
| Specimen | Conc.: 2.3 mg/ml / Embedding applied: NO / Shadowing applied: NO / Staining applied: NO / Vitrification applied: YES |
| Specimen support | Details: 200 mesh Quantifoil R2/2 grids, plasma cleaned |
| Vitrification | Instrument: LEICA EM GP / Cryogen name: ETHANE / Temp: 90.15 K / Humidity: 90 % Details: Blot for 2 seconds before plunging into liquid ethane (LEICA EM GP). Method: Blot for 2 seconds before plunging. |
- Electron microscopy imaging
| Experimental equipment |  Model: Titan Krios / Image courtesy: FEI Company |
|---|---|
| Microscopy | Model: FEI TITAN KRIOS / Date: Oct 31, 2013 / Details: Parallel beam illumination |
| Electron gun | Electron source:  FIELD EMISSION GUN / Accelerating voltage: 300 kV / Illumination mode: FLOOD BEAM / Electron beam tilt params: 5 FIELD EMISSION GUN / Accelerating voltage: 300 kV / Illumination mode: FLOOD BEAM / Electron beam tilt params: 5 |
| Electron lens | Mode: BRIGHT FIELD / Nominal magnification: 105000 X / Calibrated magnification: 105000 X / Nominal defocus max: 2500 nm / Nominal defocus min: 1000 nm / Cs: 2.7 mm Astigmatism: Objective lens astigmatism was corrected at 105,000 times magnification. Camera length: 0 mm |
| Specimen holder | Specimen holder model: FEI TITAN KRIOS AUTOGRID HOLDER / Specimen holder type: Liquid nitrogen cooled / Temperature: 79.7 K / Temperature (max): 79.8 K / Temperature (min): 79.6 K / Tilt angle max: 0 ° / Tilt angle min: 0 ° |
| Image recording | Electron dose: 45 e/Å2 / Film or detector model: GATAN K2 (4k x 4k) |
| EM imaging optics | Energyfilter name: GIF / Energyfilter upper: 20 eV / Energyfilter lower: 0 eV |
| Image scans | Num. digital images: 509 |
| Radiation | Protocol: SINGLE WAVELENGTH / Monochromatic (M) / Laue (L): M / Scattering type: x-ray |
| Radiation wavelength | Relative weight: 1 |
- Processing
| EM software |
| ||||||||||||||||||||
|---|---|---|---|---|---|---|---|---|---|---|---|---|---|---|---|---|---|---|---|---|---|
| CTF correction | Details: Individual frames of each movie were aligned by cross-correlation using the cumulative average of previously aligned frames as a reference to align the remaining frames. Parameters of the ...Details: Individual frames of each movie were aligned by cross-correlation using the cumulative average of previously aligned frames as a reference to align the remaining frames. Parameters of the contrast transfer function for each micrograph were estimated from power spectra obtained using periodogram averaging with tiles of size 512x512 pixels extracted from all frames of each movie. These power spectra were then radially averaged and used to estimate the defocus for each image using frequencies in the 15.0-3.0 Angstrom range. CTF correction was done for each particle as implemented in FREALIGN's reconstruction protocol. | ||||||||||||||||||||
| Symmetry | Point symmetry: D2 (2x2 fold dihedral) | ||||||||||||||||||||
| 3D reconstruction | Method: phase residual minimization / Resolution: 3.2 Å / Resolution method: FSC 0.143 CUT-OFF / Num. of particles: 11726 / Nominal pixel size: 0.6375 Å / Actual pixel size: 0.6375 Å Details: Reconstruction details: 24,750 particles were picked automatically from the best 509 micrographs by detecting the local maxima of correlation of each image with a Gaussian disk of 100 ...Details: Reconstruction details: 24,750 particles were picked automatically from the best 509 micrographs by detecting the local maxima of correlation of each image with a Gaussian disk of 100 Angstrom in radius and extracted using a binning factor of 2 and a box size of 384x384 pixels. Particles were then subjected to reference-free 2D classification in EMAN2. 160 classes out of a total of 250 were used for de novo initial model determination using e2initialmodel.py and imposing D2 symmetry. A subset of 23,452 particles (corresponding to the 160 classes used for the initial model building) was then used for 3D refinement using a gold-standard approach. Two stacks of 11,726 particles each were independently subjected to eight rounds of iterative refinement in FREALIGN using a high-resolution frequency limit of 8 Angstrom and using the best 50% of particles from each stack according to phase residual values (equivalent to 5,863 particles) to calculate the reconstructions at each iteration. At this point particles were re-extracted from the original unbinned micrographs using a box size of 768x768 pixels and further refined in FREALIGN starting from the most recent set of alignments obtained with the binned data. The final map was obtained by averaging the two half-reconstructions in real space and corrected by a B-factor of -85 Angstrom^2 for the purpose of visualization. Refinement type: HALF-MAPS REFINED INDEPENDENTLY / Symmetry type: POINT | ||||||||||||||||||||
| Atomic model building | Protocol: FLEXIBLE FIT / Space: REAL Details: METHOD--Local refinement, Flexible fitting DETAILS--Initial local fitting was done using Chimera and then COOT was used for flexible fitting and model building. | ||||||||||||||||||||
| Refinement step | Cycle: LAST
|
