 Movie
Movie Controller


+ Open data

- Basic information
| Entry | Database: PDB / ID: 8dhb | |||||||||||||||
|---|---|---|---|---|---|---|---|---|---|---|---|---|---|---|---|---|
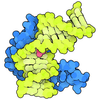
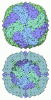
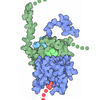
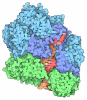
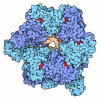
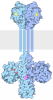
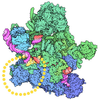
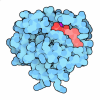
| Title | Active FLCN GAP complex | |||||||||||||||
 Components Components |
| |||||||||||||||
 Keywords Keywords | SIGNALING PROTEIN / FLCN / Rag-Ragulator / GTPase Activating Protein / mTORC1 signaling | |||||||||||||||
| Function / homology |  Function and homology information Function and homology informationasparagine transport / L-asparagine transmembrane transporter activity / negative regulation of cell proliferation involved in kidney development / regulation of pro-B cell differentiation / negative regulation of post-translational protein modification / regulation of cholesterol import / L-arginine transmembrane transport / positive regulation of protein localization to lysosome / sterol sensor activity / L-arginine transmembrane transporter activity ...asparagine transport / L-asparagine transmembrane transporter activity / negative regulation of cell proliferation involved in kidney development / regulation of pro-B cell differentiation / negative regulation of post-translational protein modification / regulation of cholesterol import / L-arginine transmembrane transport / positive regulation of protein localization to lysosome / sterol sensor activity / L-arginine transmembrane transporter activity / regulation of cell-substrate junction organization / regulation of cholesterol efflux / Gtr1-Gtr2 GTPase complex / L-glutamine transmembrane transporter activity / L-glutamine transport / FNIP-folliculin RagC/D GAP / Ragulator complex / regulation of Ras protein signal transduction / L-leucine transmembrane transporter activity / amino acid transmembrane transport / regulation of TORC1 signaling / L-amino acid transmembrane transporter activity / negative regulation of lysosome organization / protein localization to lysosome / lysosome localization / MTOR signalling / ATPase inhibitor activity / Energy dependent regulation of mTOR by LKB1-AMPK / endosome organization / Amino acids regulate mTORC1 / negative regulation of brown fat cell differentiation / negative regulation of TOR signaling / regulation of TOR signaling / cell-cell junction assembly / amino acid transmembrane transporter activity / arginine binding / negative regulation of Rho protein signal transduction / kinase activator activity / protein localization to membrane / negative regulation of cold-induced thermogenesis / negative regulation of glycolytic process / lysosome organization / azurophil granule membrane / endosomal transport / regulation of cell size / cholesterol binding / Macroautophagy / small GTPase-mediated signal transduction / positive regulation of transforming growth factor beta receptor signaling pathway / RHOJ GTPase cycle / RHOQ GTPase cycle / hemopoiesis / TORC1 signaling / glutathione transferase / regulation of receptor recycling / CDC42 GTPase cycle / response to amino acid / tertiary granule membrane / RHOG GTPase cycle / glutathione transferase activity / RHOH GTPase cycle / mTORC1-mediated signalling / ficolin-1-rich granule membrane / RAC3 GTPase cycle / RAC2 GTPase cycle / positive regulation of TOR signaling / enzyme-substrate adaptor activity / centriolar satellite / energy homeostasis / specific granule membrane / RAC1 GTPase cycle / cholesterol homeostasis / protein-membrane adaptor activity / positive regulation of TORC1 signaling / cellular response to nutrient levels / positive regulation of autophagy / guanyl-nucleotide exchange factor activity / negative regulation of autophagy / RNA splicing / viral genome replication / cellular response to amino acid starvation / negative regulation of phosphatidylinositol 3-kinase/protein kinase B signal transduction / cellular response to starvation / enzyme inhibitor activity / Regulation of PTEN gene transcription / tumor necrosis factor-mediated signaling pathway / cellular response to amino acid stimulus / glutathione metabolic process / positive regulation of interleukin-8 production / GTPase activator activity / TP53 Regulates Metabolic Genes / regulation of cell growth / phosphoprotein binding / positive regulation of protein-containing complex assembly / negative regulation of ERK1 and ERK2 cascade / positive regulation of protein localization to nucleus / MAP2K and MAPK activation / intrinsic apoptotic signaling pathway in response to DNA damage / response to virus / mitotic spindle Similarity search - Function | |||||||||||||||
| Biological species |  Homo sapiens (human) Homo sapiens (human) | |||||||||||||||
| Method | ELECTRON MICROSCOPY / single particle reconstruction / cryo EM / Resolution: 3.53 Å | |||||||||||||||
 Authors Authors | Jansen, R.M. / Hurley, J.H. | |||||||||||||||
| Funding support |  United States, United States,  Italy, 4items Italy, 4items
| |||||||||||||||
 Citation Citation | Journal: Sci Adv / Year: 2022 Title: Structural basis for FLCN RagC GAP activation in MiT-TFE substrate-selective mTORC1 regulation. Authors: Rachel M Jansen / Roberta Peruzzo / Simon A Fromm / Adam L Yokom / Roberto Zoncu / James H Hurley / Abstract: The mechanistic target of rapamycin complex 1 (mTORC1) regulates cell growth and catabolism in response to nutrients through phosphorylation of key substrates. The tumor suppressor folliculin (FLCN) ...The mechanistic target of rapamycin complex 1 (mTORC1) regulates cell growth and catabolism in response to nutrients through phosphorylation of key substrates. The tumor suppressor folliculin (FLCN) is a RagC/D guanosine triphosphatase (GTPase)-activating protein (GAP) that regulates mTORC1 phosphorylation of MiT-TFE transcription factors, controlling lysosome biogenesis and autophagy. We determined the cryo-electron microscopy structure of the active FLCN complex (AFC) containing FLCN, FNIP2, the N-terminal tail of SLC38A9, the RagA:RagC GTPase dimer, and the Ragulator scaffold. Relative to the inactive lysosomal FLCN complex structure, FLCN reorients by 90°, breaks contact with RagA, and makes previously unseen contacts with RagC that position its Arg finger for catalysis. Disruption of the AFC-specific interfaces of FLCN and FNIP2 with RagC eliminated GAP activity and led to nuclear retention of TFE3, with no effect on mTORC1 substrates S6K or 4E-BP1. The structure provides a basis for regulation of an mTORC1 substrate-specific pathway and a roadmap to discover MiT-TFE family selective mTORC1 antagonists. | |||||||||||||||
| History |
|
- Structure visualization
| Structure viewer | Molecule: MolmilJmol/JSmol |
|---|
- Downloads & links
-Download
| PDBx/mmCIF format | 8dhb.cif.gz | 393.9 KB | Display | PDBx/mmCIF format |
|---|---|---|---|---|
| PDB format | pdb8dhb.ent.gz | 288.2 KB | Display | PDB format |
| PDBx/mmJSON format | 8dhb.json.gz | Tree view | PDBx/mmJSON format | |
| Others |  Other downloads Other downloads |
-Validation report
| Arichive directory | https://data.pdbj.org/pub/pdb/validation_reports/dh/8dhbftp://data.pdbj.org/pub/pdb/validation_reports/dh/8dhb | HTTPS FTP |
|---|
-Related structure data
| Related structure data |  27435MC M: map data used to model this data C: citing same article ( |
|---|---|
| Similar structure data |
-Links
 PDBj
PDBj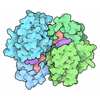
- Assembly
| Deposited unit | 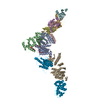
|
|---|---|
| 1 |
|
-Components
-Ras-related GTP-binding protein ... , 2 types, 2 molecules AB
| #1: Protein | Mass: 44384.004 Da / Num. of mol.: 1 Source method: isolated from a genetically manipulated source Source: (gene. exp.) Homo sapiens (human) / Gene: RRAGC / Production host: Homo sapiens (human)References: UniProt: Q9HB90, Hydrolases; Acting on acid anhydrides; Acting on GTP to facilitate cellular and subcellular movement |
|---|---|
| #2: Protein | Mass: 39362.078 Da / Num. of mol.: 1 Source method: isolated from a genetically manipulated source Source: (gene. exp.) Homo sapiens (human) / Gene: RRAGA / Production host:   Spodoptera frugiperda (fall armyworm) / References: UniProt: Q7L523 Spodoptera frugiperda (fall armyworm) / References: UniProt: Q7L523 |
-Ragulator complex protein ... , 5 types, 5 molecules CDEFG
| #3: Protein | Mass: 18325.350 Da / Num. of mol.: 1 Source method: isolated from a genetically manipulated source Source: (gene. exp.) Homo sapiens (human) / Gene: LAMTOR1, C11orf59, PDRO, PP7157 / Production host: Spodoptera frugiperda (fall armyworm) / References: UniProt: Q6IAA8 |
|---|---|
| #4: Protein | Mass: 13645.579 Da / Num. of mol.: 1 Source method: isolated from a genetically manipulated source Source: (gene. exp.) Homo sapiens (human) / Gene: LAMTOR2, MAPBPIP, ROBLD3, HSPC003 / Production host: Spodoptera frugiperda (fall armyworm) / References: UniProt: Q9Y2Q5 |
| #5: Protein | Mass: 13637.678 Da / Num. of mol.: 1 Source method: isolated from a genetically manipulated source Source: (gene. exp.) Homo sapiens (human) / Gene: LAMTOR3, MAP2K1IP1, MAPKSP1, PRO2783 / Production host: Spodoptera frugiperda (fall armyworm) / References: UniProt: Q9UHA4 |
| #6: Protein | Mass: 10753.236 Da / Num. of mol.: 1 Source method: isolated from a genetically manipulated source Source: (gene. exp.) Homo sapiens (human) / Gene: LAMTOR4, C7orf59 / Production host: Homo sapiens (human) / References: UniProt: Q0VGL1 |
| #7: Protein | Mass: 18178.520 Da / Num. of mol.: 1 Source method: isolated from a genetically manipulated source Source: (gene. exp.) Homo sapiens (human) / Gene: LAMTOR5, HBXIP, hCG_40252 / Production host: Homo sapiens (human) / References: UniProt: A0A0C4DGV4 |
-Protein , 3 types, 3 molecules HIJ
| #8: Protein | Mass: 41000.711 Da / Num. of mol.: 1 Source method: isolated from a genetically manipulated source Source: (gene. exp.) Homo sapiens (human) / Gene: SLC38A9, URLC11 / Production host: Homo sapiens (human)References: UniProt: P08515, UniProt: Q8NBW4, glutathione transferase |
|---|---|
| #9: Protein | Mass: 149865.641 Da / Num. of mol.: 1 Source method: isolated from a genetically manipulated source Source: (gene. exp.) Homo sapiens (human) / Gene: FNIP2, FNIPL, KIAA1450, MAPO1 / Production host: Homo sapiens (human) / References: UniProt: Q9P278 |
| #10: Protein | Mass: 69143.070 Da / Num. of mol.: 1 Source method: isolated from a genetically manipulated source Source: (gene. exp.) Homo sapiens (human) / Gene: FLCN, BHD / Production host: Homo sapiens (human) / References: UniProt: Q8NFG4 |
-Non-polymers , 3 types, 3 molecules 

| #11: Chemical | ChemComp-CZC / [( Mass: 444.185 Da / Num. of mol.: 1 / Source method: obtained synthetically / Formula: C10H14N4O12P2 / Feature type: SUBJECT OF INVESTIGATION Mass: 444.185 Da / Num. of mol.: 1 / Source method: obtained synthetically / Formula: C10H14N4O12P2 / Feature type: SUBJECT OF INVESTIGATION |
|---|---|
| #12: Chemical | ChemComp-BEF /  Mass: 66.007 Da / Num. of mol.: 1 / Source method: obtained synthetically / Formula: BeF3 / Feature type: SUBJECT OF INVESTIGATION Mass: 66.007 Da / Num. of mol.: 1 / Source method: obtained synthetically / Formula: BeF3 / Feature type: SUBJECT OF INVESTIGATION |
| #13: Chemical | ChemComp-GDP /  Type: RNA linking / Mass: 443.201 Da / Num. of mol.: 1 / Source method: obtained synthetically / Formula: C10H15N5O11P2 / Comment: GDP, energy-carrying molecule*YM Type: RNA linking / Mass: 443.201 Da / Num. of mol.: 1 / Source method: obtained synthetically / Formula: C10H15N5O11P2 / Comment: GDP, energy-carrying molecule*YM |
-Details
| Has ligand of interest | Y |
|---|---|
| Has protein modification | Y |
-Experimental details
-Experiment
| Experiment | Method: ELECTRON MICROSCOPY |
|---|---|
| EM experiment | Aggregation state: PARTICLE / 3D reconstruction method: single particle reconstruction |
- Sample preparation
| Component |
| ||||||||||||||||||||||||
|---|---|---|---|---|---|---|---|---|---|---|---|---|---|---|---|---|---|---|---|---|---|---|---|---|---|
| Molecular weight |
| ||||||||||||||||||||||||
| Source (natural) |
| ||||||||||||||||||||||||
| Source (recombinant) |
| ||||||||||||||||||||||||
| Buffer solution | pH: 7.4 | ||||||||||||||||||||||||
| Specimen | Conc.: 1 mg/ml / Embedding applied: NO / Shadowing applied: NO / Staining applied: NO / Vitrification applied: YES | ||||||||||||||||||||||||
| Vitrification | Cryogen name: ETHANE / Humidity: 100 % / Chamber temperature: 277.15 K |
- Electron microscopy imaging
| Experimental equipment |  Model: Titan Krios / Image courtesy: FEI Company |
|---|---|
| Microscopy | Model: FEI TITAN KRIOS |
| Electron gun | Electron source:  FIELD EMISSION GUN / Accelerating voltage: 300 kV / Illumination mode: FLOOD BEAM FIELD EMISSION GUN / Accelerating voltage: 300 kV / Illumination mode: FLOOD BEAM |
| Electron lens | Mode: BRIGHT FIELD / Nominal defocus max: 2000 nm / Nominal defocus min: 1000 nm |
| Image recording | Electron dose: 50 e/Å2 / Film or detector model: GATAN K3 (6k x 4k) |
- Processing
| CTF correction | Type: PHASE FLIPPING AND AMPLITUDE CORRECTION |
|---|---|
| 3D reconstruction | Resolution: 3.53 Å / Resolution method: FSC 0.143 CUT-OFF / Num. of particles: 177018 / Symmetry type: POINT |
