Movie
Movie Controller


+ Open data

- Basic information
| Entry |  | |||||||||
|---|---|---|---|---|---|---|---|---|---|---|
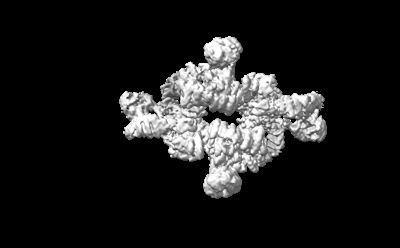
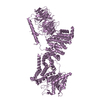
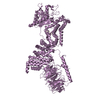
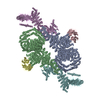
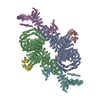
| Title | cryo-EM structure of human LST2 bound to human mTOR complex 1 | |||||||||
 Map data Map data | ||||||||||
 Sample Sample |
| |||||||||
 Keywords Keywords | MTOR / MTORC1 / LST2 / ZFYVE28 / EGFR / TOS / SIGNALING PROTEIN | |||||||||
| Biological species |  Homo sapiens (human) Homo sapiens (human) | |||||||||
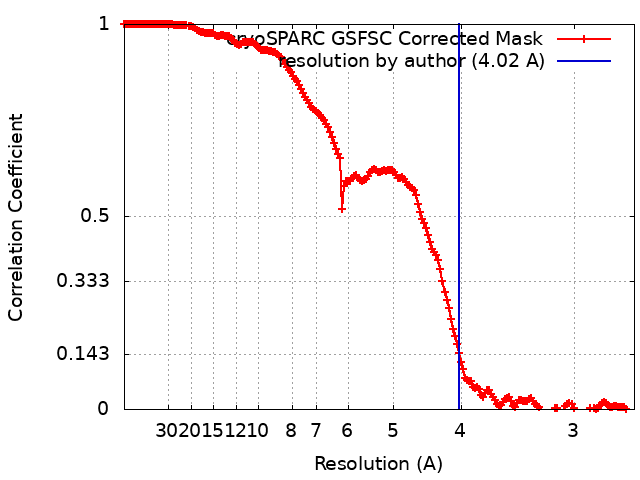
| Method | single particle reconstruction / cryo EM / Resolution: 4.02 Å | |||||||||
 Authors Authors | Craigie LM / Maier T | |||||||||
| Funding support |  Switzerland, European Union, 2 items Switzerland, European Union, 2 items
| |||||||||
 Citation Citation | Journal: Proc Natl Acad Sci U S A / Year: 2024 Title: mTORC1 phosphorylates and stabilizes LST2 to negatively regulate EGFR. Authors: Stefania Battaglioni / Louise-Marie Craigie / Sofia Filippini / Timm Maier / Michael N Hall / Abstract: TORC1 (target of rapamycin complex 1) is a highly conserved protein kinase that plays a central role in regulating cell growth. Given the role of mammalian TORC1 (mTORC1) in metabolism and disease, ...TORC1 (target of rapamycin complex 1) is a highly conserved protein kinase that plays a central role in regulating cell growth. Given the role of mammalian TORC1 (mTORC1) in metabolism and disease, understanding mTORC1 downstream signaling and feedback loops is important. mTORC1 recognizes some of its substrates via a five amino acid binding sequence called the TOR signaling (TOS) motif. mTORC1 binding to a TOS motif facilitates phosphorylation of a distinct, distal site. Here, we show that LST2, also known as ZFYVE28, contains a TOS motif (amino acids 401 to 405) and is directly phosphorylated by mTORC1 at serine 670 (S670). mTORC1-mediated S670 phosphorylation promotes LST2 monoubiquitination on lysine 87 (K87). Monoubiquitinated LST2 is stable and displays a broad reticular distribution. When mTORC1 is inactive, unphosphorylated LST2 is degraded by the proteasome. The absence of LST2 enhances EGFR (epidermal growth factor receptor) signaling. We propose that mTORC1 negatively feeds back on its upstream receptor EGFR via LST2. | |||||||||
| History |
|
- Structure visualization
| Supplemental images |
|---|
- Downloads & links
-EMDB archive
| Map data | emd_50253.map.gz | 257.4 MB |  EMDB map data format EMDB map data format | |
|---|---|---|---|---|
| Header (meta data) | emd-50253-v30.xmlemd-50253.xml | 13.9 KB 13.9 KB | Display Display | EMDB header |
| FSC (resolution estimation) | emd_50253_fsc.xml | 16.9 KB | Display | FSC data file |
| Images |  emd_50253.png emd_50253.png | 34.5 KB | ||
| Filedesc metadata | emd-50253.cif.gz | 4.1 KB | ||
| Others | emd_50253_half_map_1.map.gzemd_50253_half_map_2.map.gz | 475.8 MB 475.8 MB | ||
| Archive directory |  http://ftp.pdbj.org/pub/emdb/structures/EMD-50253ftp://ftp.pdbj.org/pub/emdb/structures/EMD-50253 http://ftp.pdbj.org/pub/emdb/structures/EMD-50253ftp://ftp.pdbj.org/pub/emdb/structures/EMD-50253 | HTTPS FTP |
-Validation report
| Summary document | emd_50253_validation.pdf.gz | 836.3 KB | Display | EMDB validaton report |
|---|---|---|---|---|
| Full document | emd_50253_full_validation.pdf.gz | 835.8 KB | Display | |
| Data in XML | emd_50253_validation.xml.gz | 25.9 KB | Display | |
| Data in CIF | emd_50253_validation.cif.gz | 34.2 KB | Display | |
| Arichive directory | https://ftp.pdbj.org/pub/emdb/validation_reports/EMD-50253ftp://ftp.pdbj.org/pub/emdb/validation_reports/EMD-50253 | HTTPS FTP |
-Related structure data


-Links
| EMDB pages | EMDB (EBI/PDBe) / EMDataResource |
|---|
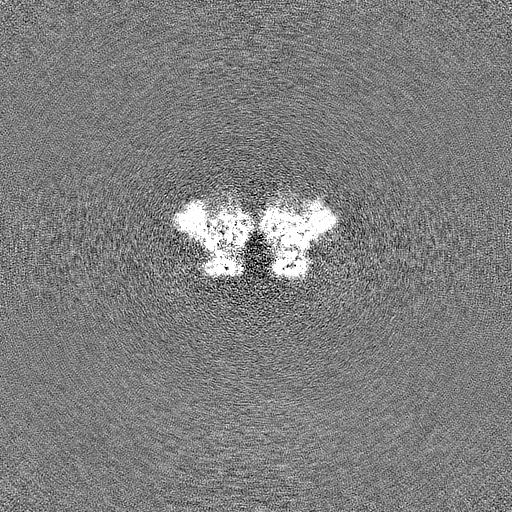
-Map
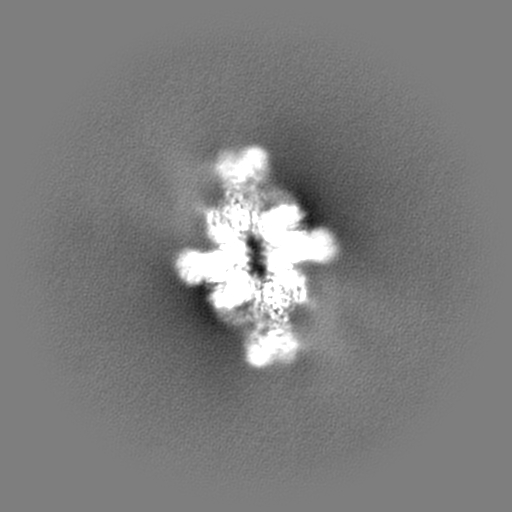
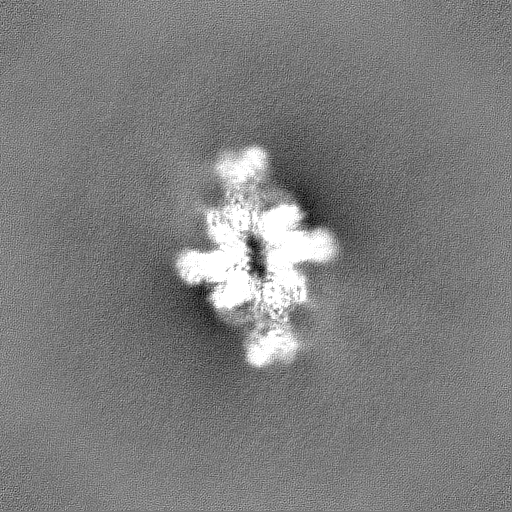
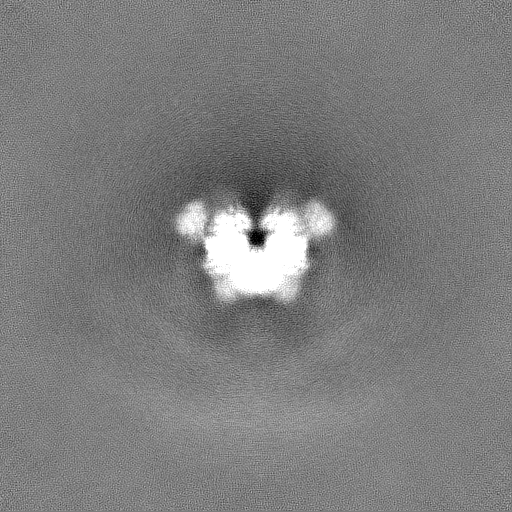
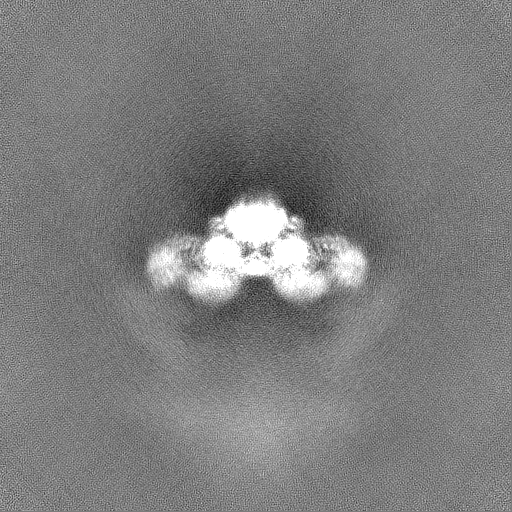
| File | Download / File: emd_50253.map.gz / Format: CCP4 / Size: 512 MB / Type: IMAGE STORED AS FLOATING POINT NUMBER (4 BYTES) | ||||||||||||||||||||||||||||||||||||
|---|---|---|---|---|---|---|---|---|---|---|---|---|---|---|---|---|---|---|---|---|---|---|---|---|---|---|---|---|---|---|---|---|---|---|---|---|---|
| Projections & slices | Image control
Images are generated by Spider. | ||||||||||||||||||||||||||||||||||||
| Voxel size | X=Y=Z: 1.31 Å | ||||||||||||||||||||||||||||||||||||
| Density |
| ||||||||||||||||||||||||||||||||||||
| Symmetry | Space group: 1 | ||||||||||||||||||||||||||||||||||||
| Details | EMDB XML:
|
 Z (Sec.)
 Y (Row.)
 X (Col.)


-Supplemental data
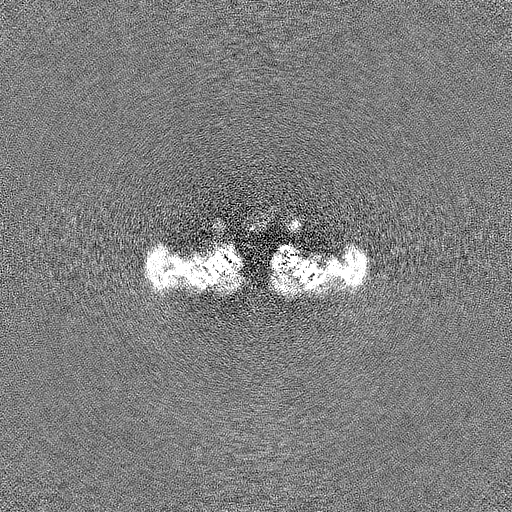
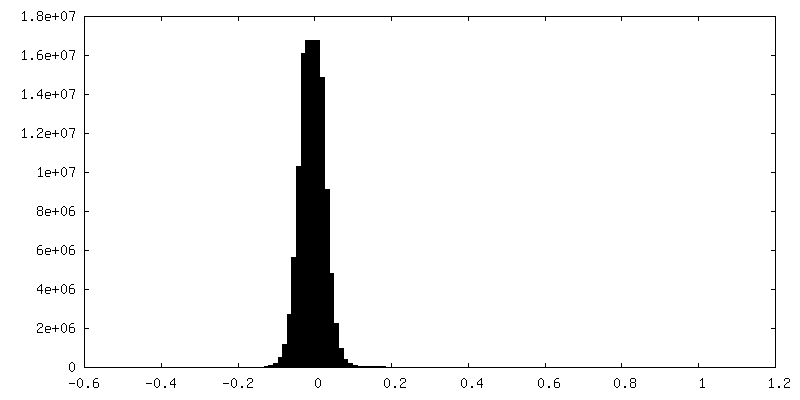
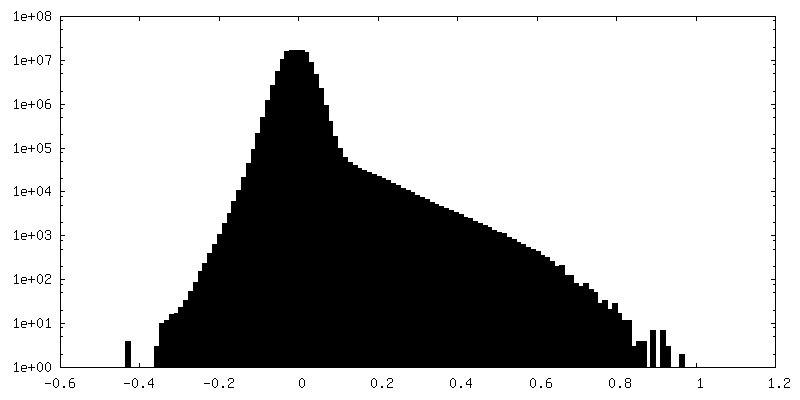
-Half map: #1
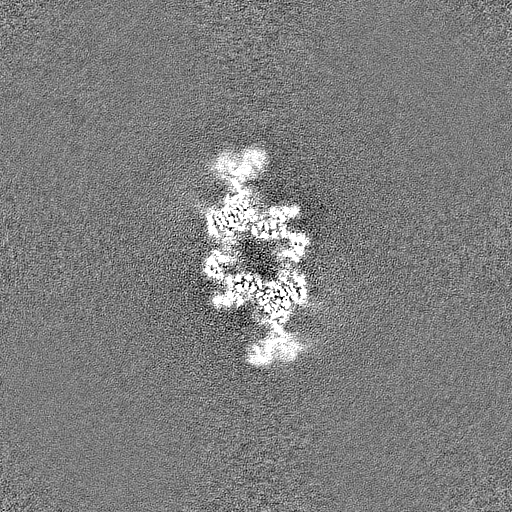
| File | emd_50253_half_map_1.map | ||||||||||||
|---|---|---|---|---|---|---|---|---|---|---|---|---|---|
| Projections & Slices |
| ||||||||||||
| Density Histograms |
- Sample components
-Entire : mTORC1 in complex with LST2
| Entire | Name: mTORC1 in complex with LST2 |
|---|---|
| Components |
|
-Supramolecule #1: mTORC1 in complex with LST2
| Supramolecule | Name: mTORC1 in complex with LST2 / type: complex / ID: 1 / Parent: 0 / Macromolecule list: #1-#4 |
|---|---|
| Source (natural) | Organism: Homo sapiens (human) |
-Experimental details
-Structure determination
| Method | cryo EM |
|---|---|
 Processing Processing | single particle reconstruction |
| Aggregation state | particle |
-Sample preparation
| Concentration | 1 mg/mL |
|---|---|
| Buffer | pH: 8 |
| Vitrification | Cryogen name: ETHANE / Chamber humidity: 95 % / Chamber temperature: 281 K / Instrument: FEI VITROBOT MARK IV |
- Electron microscopy
| Microscope | FEI TITAN KRIOS |
|---|---|
| Image recording | Film or detector model: GATAN K2 SUMMIT (4k x 4k) / Detector mode: COUNTING / Number grids imaged: 1 / Number real images: 4719 / Average electron dose: 43.0 e/Å2 |
| Electron beam | Acceleration voltage: 300 kV / Electron source:  FIELD EMISSION GUN FIELD EMISSION GUN |
| Electron optics | Illumination mode: FLOOD BEAM / Imaging mode: BRIGHT FIELD / Nominal defocus max: 2.5 µm / Nominal defocus min: 1.0 µm |
| Experimental equipment |  Model: Titan Krios / Image courtesy: FEI Company |
+Image processing
-Atomic model buiding 1
| Initial model | PDB ID: Chain - Source name: PDB / Chain - Initial model type: experimental model |
|---|