 Movie
Movie Controller

[English] 日本語
 Yorodumi
- EMDB-45235: Subtomogram average (C1) of fatty acid synthase from S.cerevisiae... -
+ Open data

- Basic information
| Entry |  | |||||||||
|---|---|---|---|---|---|---|---|---|---|---|
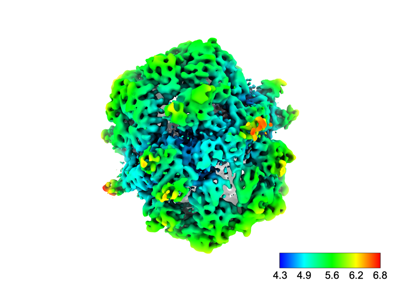
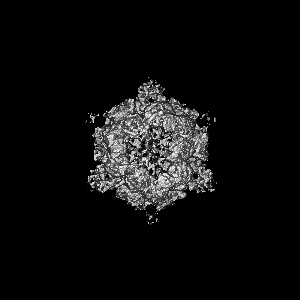
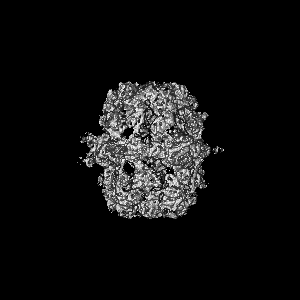
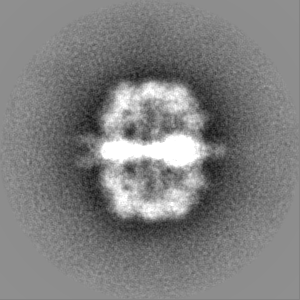
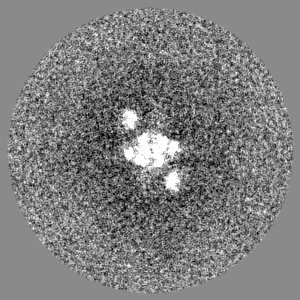
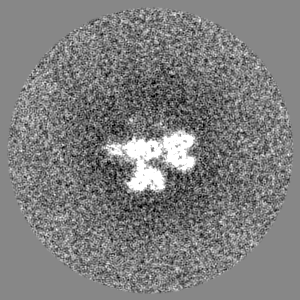
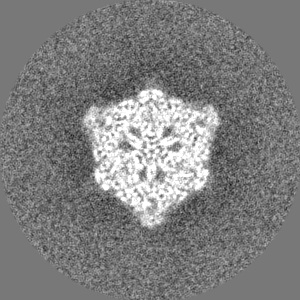
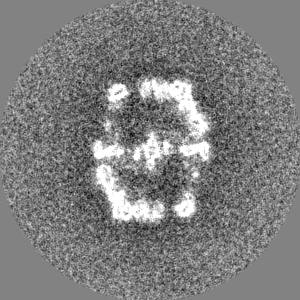
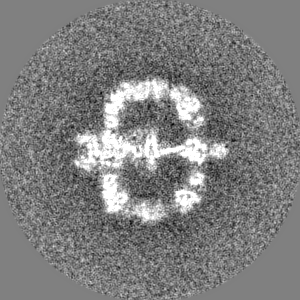
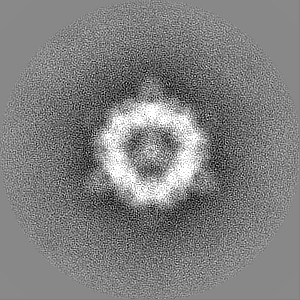
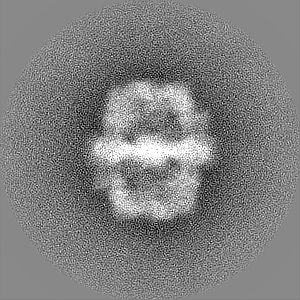
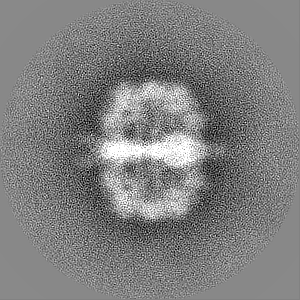
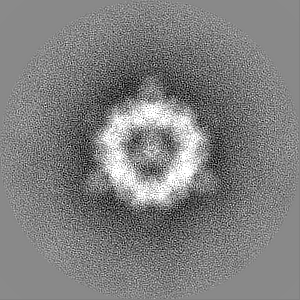
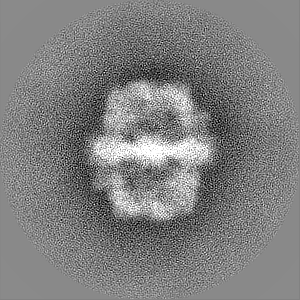
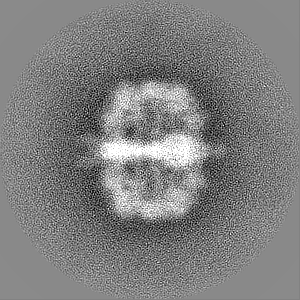
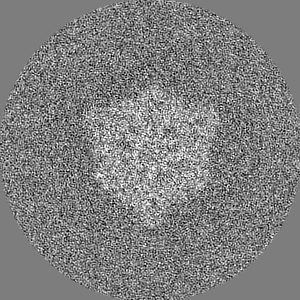
| Title | Subtomogram average (C1) of fatty acid synthase from S.cerevisiae prepared using cryo-plasmaFIB milling | |||||||||
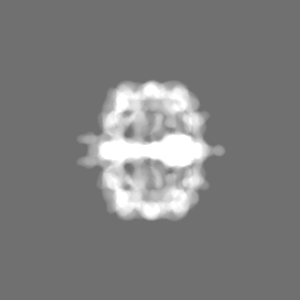
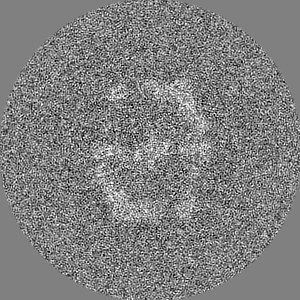
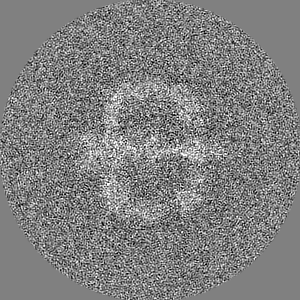
 Map data Map data | cryoDRGN-ET selected C1 refined sub volumes | |||||||||
 Sample Sample |
| |||||||||
 Keywords Keywords | Complex / LIPID BINDING PROTEIN | |||||||||
| Biological species |  | |||||||||
| Method | subtomogram averaging / cryo EM / Resolution: 8.8 Å | |||||||||
 Authors Authors | Feathers JR / Zhong ED / Khavnekar S | |||||||||
| Funding support |  United States, 1 items United States, 1 items
| |||||||||
 Citation Citation | Journal: Nat Methods / Year: 2024 Title: CryoDRGN-ET: deep reconstructing generative networks for visualizing dynamic biomolecules inside cells. Authors: Ramya Rangan / Ryan Feathers / Sagar Khavnekar / Adam Lerer / Jake D Johnston / Ron Kelley / Martin Obr / Abhay Kotecha / Ellen D Zhong /   Abstract: Advances in cryo-electron tomography (cryo-ET) have produced new opportunities to visualize the structures of dynamic macromolecules in native cellular environments. While cryo-ET can reveal ...Advances in cryo-electron tomography (cryo-ET) have produced new opportunities to visualize the structures of dynamic macromolecules in native cellular environments. While cryo-ET can reveal structures at molecular resolution, image processing algorithms remain a bottleneck in resolving the heterogeneity of biomolecular structures in situ. Here, we introduce cryoDRGN-ET for heterogeneous reconstruction of cryo-ET subtomograms. CryoDRGN-ET learns a deep generative model of three-dimensional density maps directly from subtomogram tilt-series images and can capture states diverse in both composition and conformation. We validate this approach by recovering the known translational states in Mycoplasma pneumoniae ribosomes in situ. We then perform cryo-ET on cryogenic focused ion beam-milled Saccharomyces cerevisiae cells. CryoDRGN-ET reveals the structural landscape of S. cerevisiae ribosomes during translation and captures continuous motions of fatty acid synthase complexes inside cells. This method is openly available in the cryoDRGN software. | |||||||||
| History |
|
- Structure visualization
| Supplemental images |
|---|
- Downloads & links
-EMDB archive
| Map data | emd_45235.map.gz | 80.9 MB |  EMDB map data format EMDB map data format | |
|---|---|---|---|---|
| Header (meta data) | emd-45235-v30.xmlemd-45235.xml | 15.2 KB 15.2 KB | Display Display | EMDB header |
| FSC (resolution estimation) | emd_45235_fsc.xml | 10.7 KB | Display | FSC data file |
| Images |  emd_45235.png emd_45235.png | 65.9 KB | ||
| Masks | emd_45235_msk_1.map | 103 MB | Mask map | |
| Filedesc metadata | emd-45235.cif.gz | 4.2 KB | ||
| Others | emd_45235_additional_1.map.gzemd_45235_half_map_1.map.gzemd_45235_half_map_2.map.gz | 6.5 MB 81 MB 81 MB | ||
| Archive directory |  http://ftp.pdbj.org/pub/emdb/structures/EMD-45235ftp://ftp.pdbj.org/pub/emdb/structures/EMD-45235 http://ftp.pdbj.org/pub/emdb/structures/EMD-45235ftp://ftp.pdbj.org/pub/emdb/structures/EMD-45235 | HTTPS FTP |
-Validation report
| Summary document | emd_45235_validation.pdf.gz | 1.3 MB | Display | EMDB validaton report |
|---|---|---|---|---|
| Full document | emd_45235_full_validation.pdf.gz | 1.3 MB | Display | |
| Data in XML | emd_45235_validation.xml.gz | 18.2 KB | Display | |
| Data in CIF | emd_45235_validation.cif.gz | 23.7 KB | Display | |
| Arichive directory | https://ftp.pdbj.org/pub/emdb/validation_reports/EMD-45235ftp://ftp.pdbj.org/pub/emdb/validation_reports/EMD-45235 | HTTPS FTP |
-Related structure data
-Links
| EMDB pages | EMDB (EBI/PDBe) / EMDataResource |
|---|
-Map
| File | Download / File: emd_45235.map.gz / Format: CCP4 / Size: 103 MB / Type: IMAGE STORED AS FLOATING POINT NUMBER (4 BYTES) | ||||||||||||||||||||||||||||||||||||
|---|---|---|---|---|---|---|---|---|---|---|---|---|---|---|---|---|---|---|---|---|---|---|---|---|---|---|---|---|---|---|---|---|---|---|---|---|---|
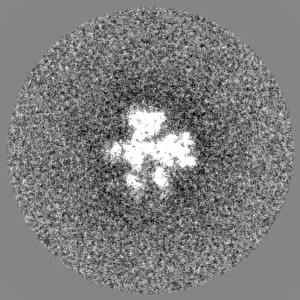
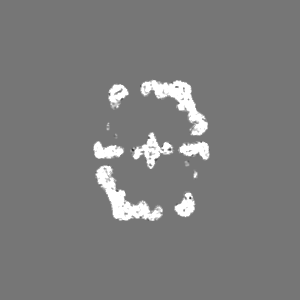
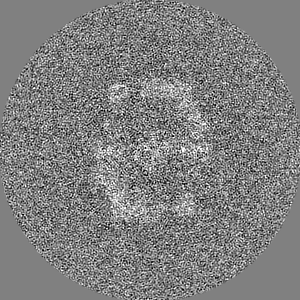
| Annotation | cryoDRGN-ET selected C1 refined sub volumes | ||||||||||||||||||||||||||||||||||||
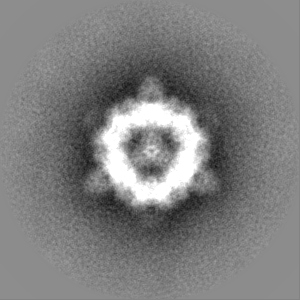
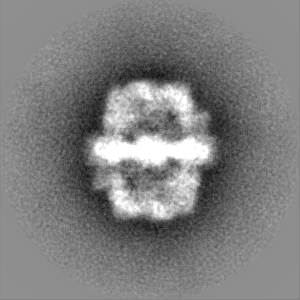
| Projections & slices | Image control
Images are generated by Spider. | ||||||||||||||||||||||||||||||||||||
| Voxel size | X=Y=Z: 1.96 Å | ||||||||||||||||||||||||||||||||||||
| Density |
| ||||||||||||||||||||||||||||||||||||
| Symmetry | Space group: 1 | ||||||||||||||||||||||||||||||||||||
| Details | EMDB XML:
|
 Z (Sec.)
 Y (Row.)
 X (Col.)


-Supplemental data
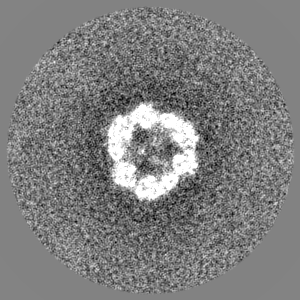
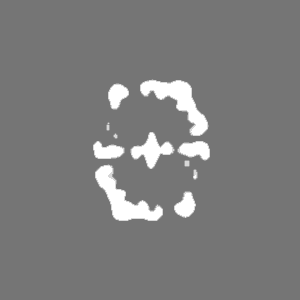
-Mask #1
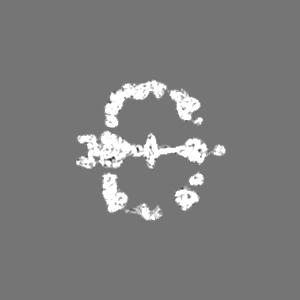
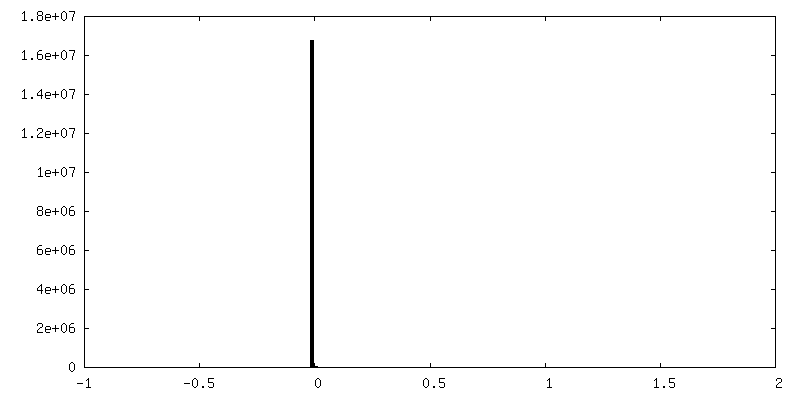
| File | emd_45235_msk_1.map | ||||||||||||
|---|---|---|---|---|---|---|---|---|---|---|---|---|---|
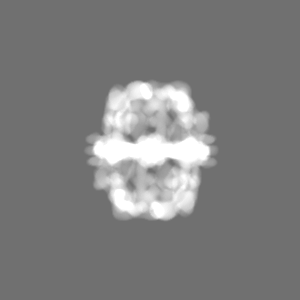
| Projections & Slices |
| ||||||||||||
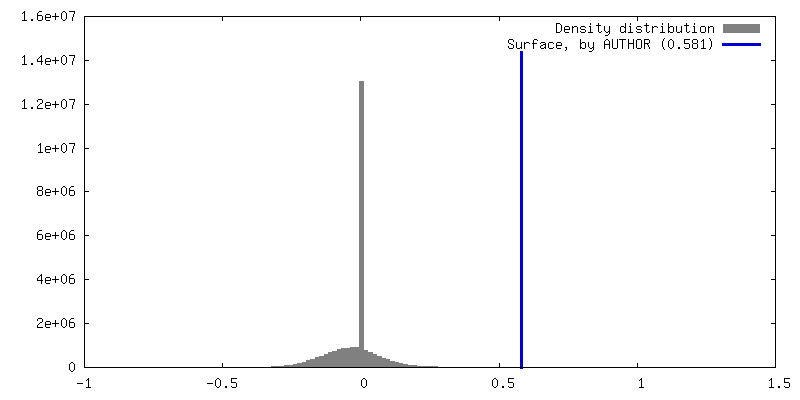
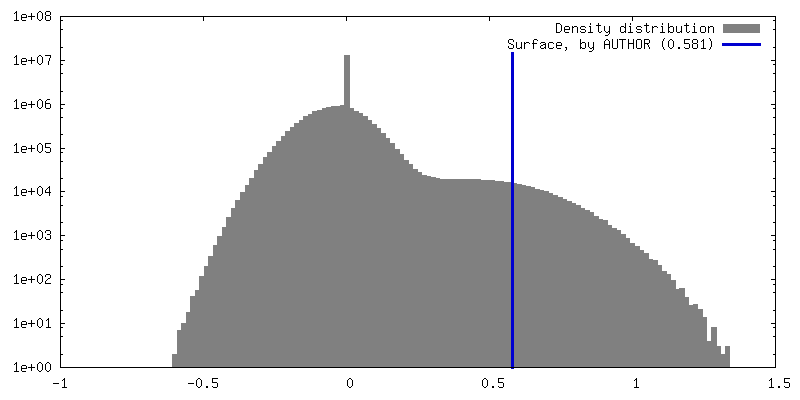
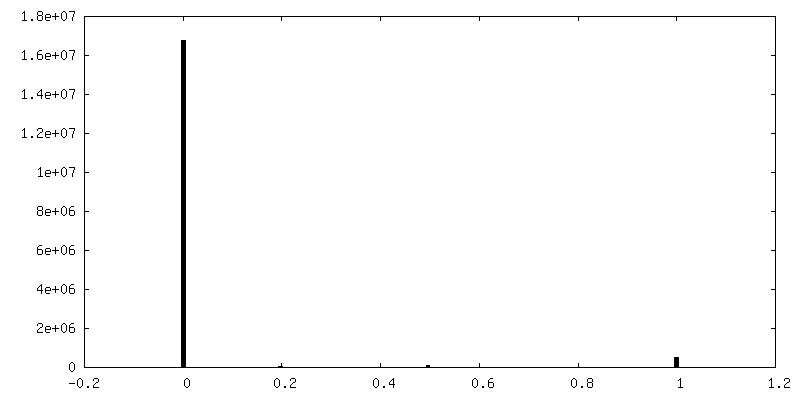
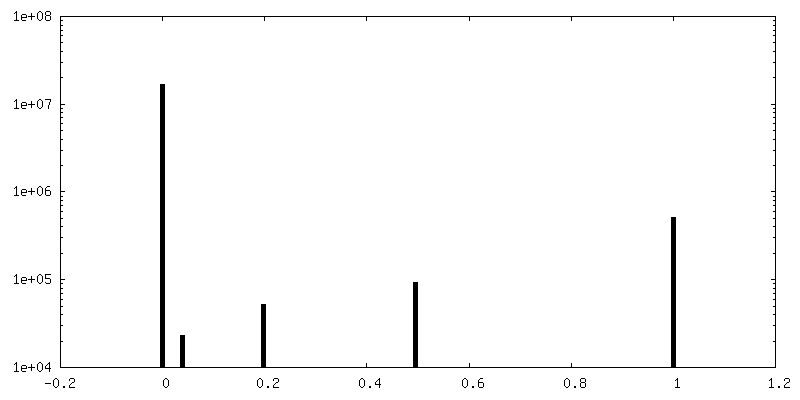
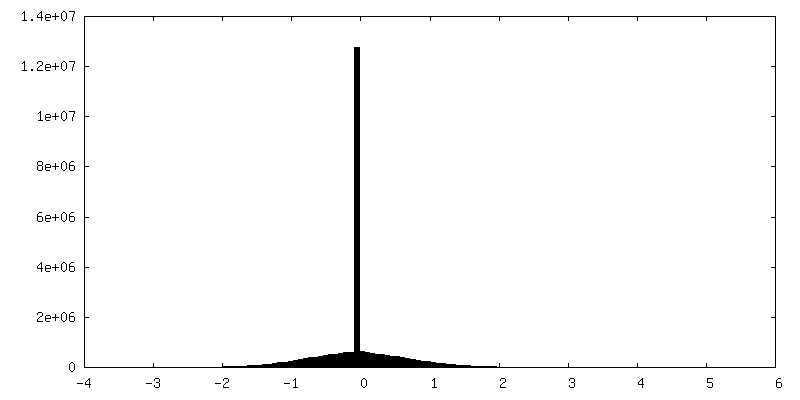
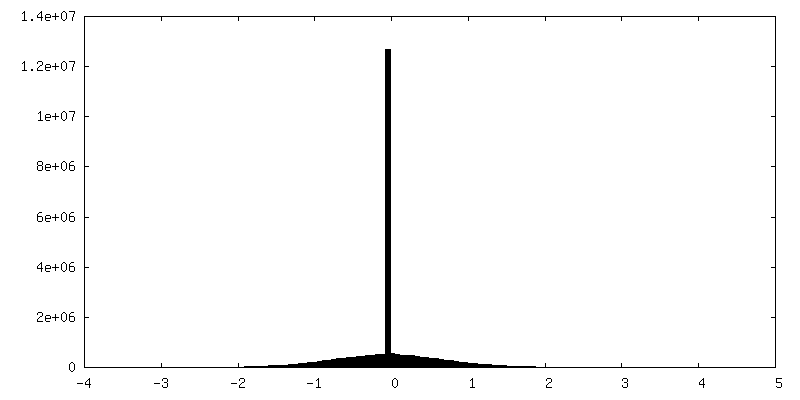
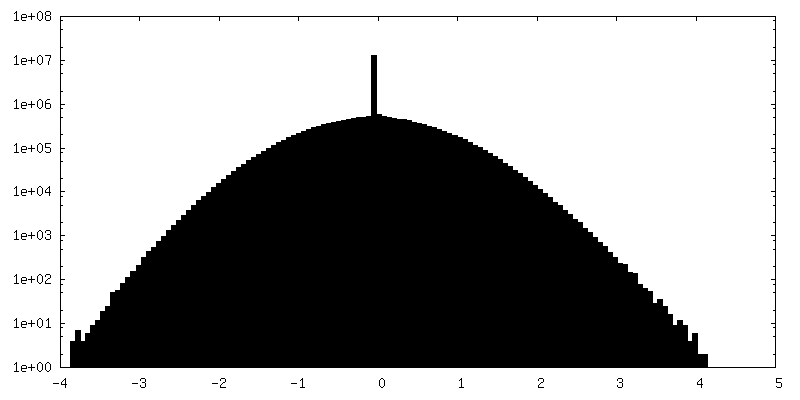
| Density Histograms |


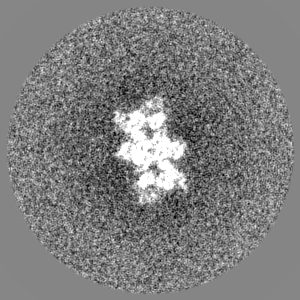
-Additional map: RELION Postprocess sharpened map with B-factor -100
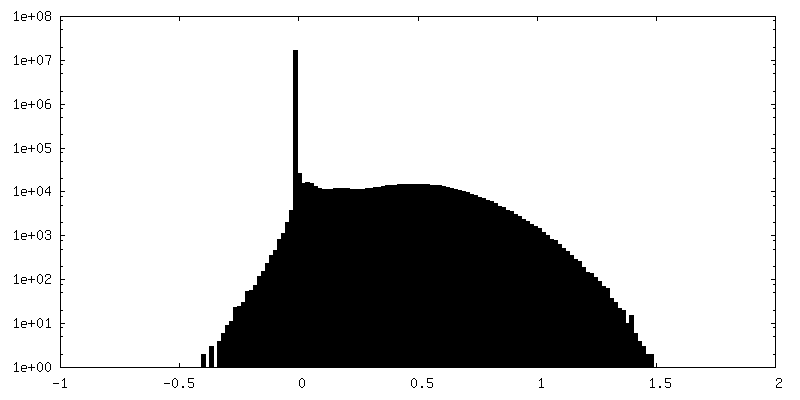
| File | emd_45235_additional_1.map | ||||||||||||
|---|---|---|---|---|---|---|---|---|---|---|---|---|---|
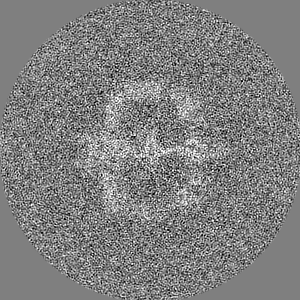
| Annotation | RELION Postprocess sharpened map with B-factor -100 | ||||||||||||
| Projections & Slices |
| ||||||||||||
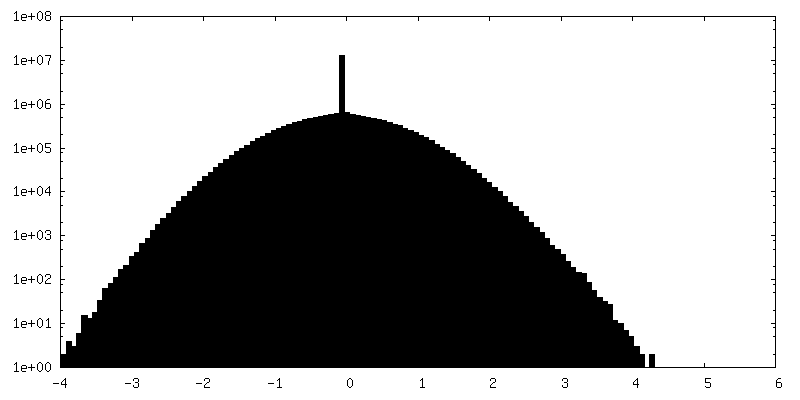
| Density Histograms |
-Half map: Half map 1
| File | emd_45235_half_map_1.map | ||||||||||||
|---|---|---|---|---|---|---|---|---|---|---|---|---|---|
| Annotation | Half map 1 | ||||||||||||
| Projections & Slices |
| ||||||||||||
| Density Histograms |
-Half map: Half map 2
| File | emd_45235_half_map_2.map | ||||||||||||
|---|---|---|---|---|---|---|---|---|---|---|---|---|---|
| Annotation | Half map 2 | ||||||||||||
| Projections & Slices |
| ||||||||||||
| Density Histograms |
- Sample components
-Entire : Yeast fatty acid synthase complex
| Entire | Name: Yeast fatty acid synthase complex |
|---|---|
| Components |
|
-Supramolecule #1: Yeast fatty acid synthase complex
| Supramolecule | Name: Yeast fatty acid synthase complex / type: complex / ID: 1 / Parent: 0 |
|---|---|
| Source (natural) | Organism: |
| Molecular weight | Theoretical: 2 MDa |
-Experimental details
-Structure determination
| Method | cryo EM |
|---|---|
 Processing Processing | subtomogram averaging |
| Aggregation state | cell |
-Sample preparation
| Buffer | pH: 7 |
|---|---|
| Vitrification | Cryogen name: ETHANE |
- Electron microscopy
| Microscope | FEI TITAN KRIOS |
|---|---|
| Image recording | Film or detector model: FEI FALCON IV (4k x 4k) / Average electron dose: 3.5 e/Å2 |
| Electron beam | Acceleration voltage: 300 kV / Electron source:  FIELD EMISSION GUN FIELD EMISSION GUN |
| Electron optics | Illumination mode: FLOOD BEAM / Imaging mode: BRIGHT FIELD / Nominal defocus max: 3.5 µm / Nominal defocus min: 1.5 µm |
| Experimental equipment |  Model: Titan Krios / Image courtesy: FEI Company |
-Image processing
| Final reconstruction | Applied symmetry - Point group: C1 (asymmetric) / Resolution.type: BY AUTHOR / Resolution: 8.8 Å / Resolution method: FSC 0.143 CUT-OFF / Number subtomograms used: 5239 |
|---|---|
| Extraction | Number tomograms: 263 / Number images used: 33492 |
| Final angle assignment | Type: MAXIMUM LIKELIHOOD / Software - Name: RELION |
| FSC plot (resolution estimation) | 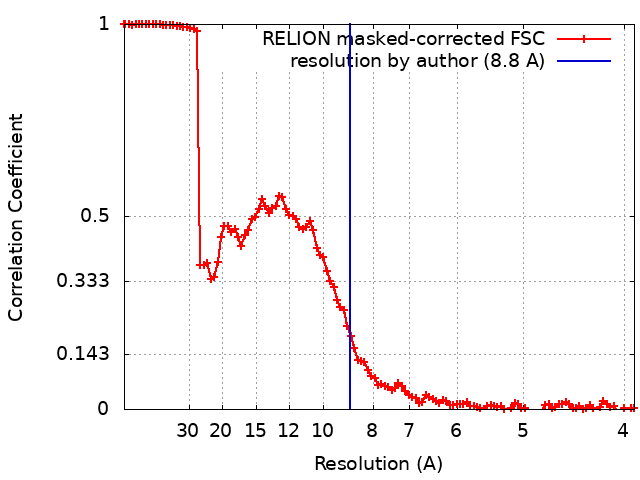 |
