Movie
Movie Controller


+ Open data

- Basic information
| Entry |  | |||||||||
|---|---|---|---|---|---|---|---|---|---|---|
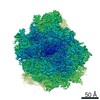
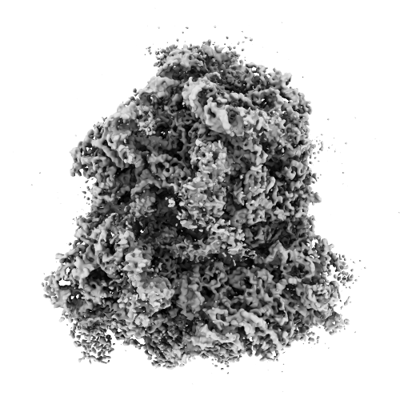
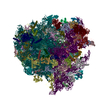
| Title | 80S ribosome with H13A angiogenin and tRNA | |||||||||
 Map data Map data | 80S ribosome with H13A angiogenin and tRNA | |||||||||
 Sample Sample |
| |||||||||
 Keywords Keywords | Angiogenin / RNase / RIBOSOME | |||||||||
| Biological species |   Homo sapiens (human) / Homo sapiens (human) /   | |||||||||
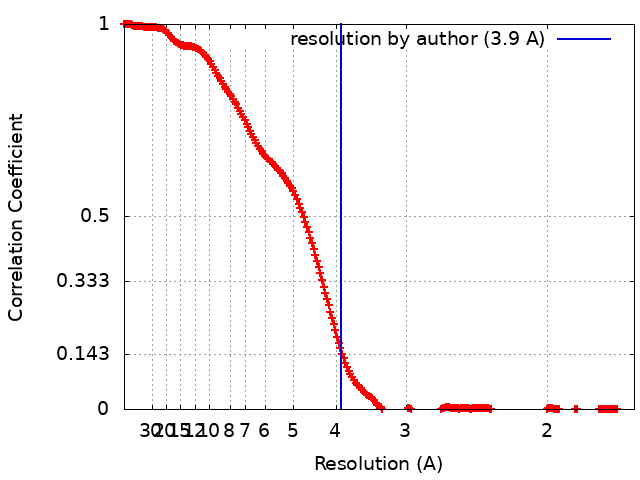
| Method | single particle reconstruction / cryo EM / Resolution: 3.9 Å | |||||||||
 Authors Authors | Loveland AB / Korostelev AA | |||||||||
| Funding support |  United States, 1 items United States, 1 items
| |||||||||
 Citation Citation | Journal: Nature / Year: 2024 Title: Structural mechanism of angiogenin activation by the ribosome. Authors: Anna B Loveland / Cha San Koh / Robin Ganesan / Allan Jacobson / Andrei A Korostelev / Abstract: Angiogenin, an RNase-A-family protein, promotes angiogenesis and has been implicated in cancer, neurodegenerative diseases and epigenetic inheritance. After activation during cellular stress, ...Angiogenin, an RNase-A-family protein, promotes angiogenesis and has been implicated in cancer, neurodegenerative diseases and epigenetic inheritance. After activation during cellular stress, angiogenin cleaves tRNAs at the anticodon loop, resulting in translation repression. However, the catalytic activity of isolated angiogenin is very low, and the mechanisms of the enzyme activation and tRNA specificity have remained a puzzle. Here we identify these mechanisms using biochemical assays and cryogenic electron microscopy (cryo-EM). Our study reveals that the cytosolic ribosome is the activator of angiogenin. A cryo-EM structure features angiogenin bound in the A site of the 80S ribosome. The C-terminal tail of angiogenin is rearranged by interactions with the ribosome to activate the RNase catalytic centre, making the enzyme several orders of magnitude more efficient in tRNA cleavage. Additional 80S-angiogenin structures capture how tRNA substrate is directed by the ribosome into angiogenin's active site, demonstrating that the ribosome acts as the specificity factor. Our findings therefore suggest that angiogenin is activated by ribosomes with a vacant A site, the abundance of which increases during cellular stress. These results may facilitate the development of therapeutics to treat cancer and neurodegenerative diseases. | |||||||||
| History |
|
- Structure visualization
| Supplemental images |
|---|
- Downloads & links
-EMDB archive
| Map data | emd_44460.map.gz | 794.3 MB |  EMDB map data format EMDB map data format | |
|---|---|---|---|---|
| Header (meta data) | emd-44460-v30.xmlemd-44460.xml | 17.8 KB 17.8 KB | Display Display | EMDB header |
| FSC (resolution estimation) | emd_44460_fsc.xml | 20.4 KB | Display | FSC data file |
| Images |  emd_44460.png emd_44460.png | 120.5 KB | ||
| Filedesc metadata | emd-44460.cif.gz | 4.5 KB | ||
| Others | emd_44460_additional_1.map.gzemd_44460_half_map_1.map.gzemd_44460_half_map_2.map.gz | 794 MB 166.8 MB 166.8 MB | ||
| Archive directory |  http://ftp.pdbj.org/pub/emdb/structures/EMD-44460ftp://ftp.pdbj.org/pub/emdb/structures/EMD-44460 http://ftp.pdbj.org/pub/emdb/structures/EMD-44460ftp://ftp.pdbj.org/pub/emdb/structures/EMD-44460 | HTTPS FTP |
-Related structure data


-Links
| EMDB pages | EMDB (EBI/PDBe) / EMDataResource |
|---|
-Map
| File | Download / File: emd_44460.map.gz / Format: CCP4 / Size: 857.4 MB / Type: IMAGE STORED AS FLOATING POINT NUMBER (4 BYTES) | ||||||||||||||||||||||||||||||||||||
|---|---|---|---|---|---|---|---|---|---|---|---|---|---|---|---|---|---|---|---|---|---|---|---|---|---|---|---|---|---|---|---|---|---|---|---|---|---|
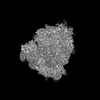
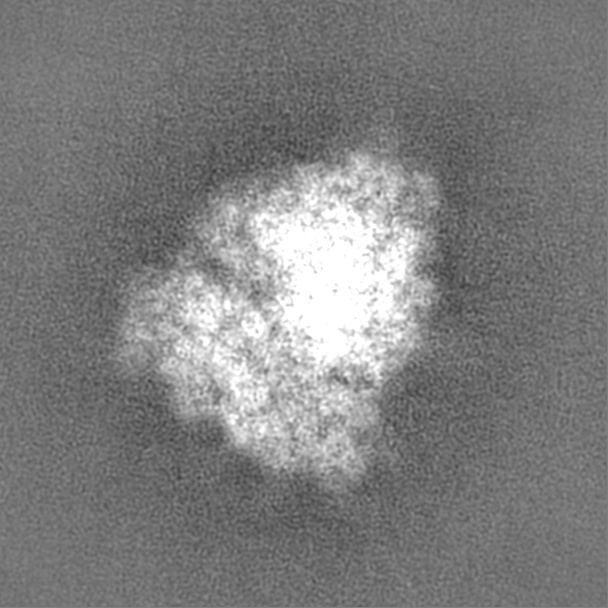
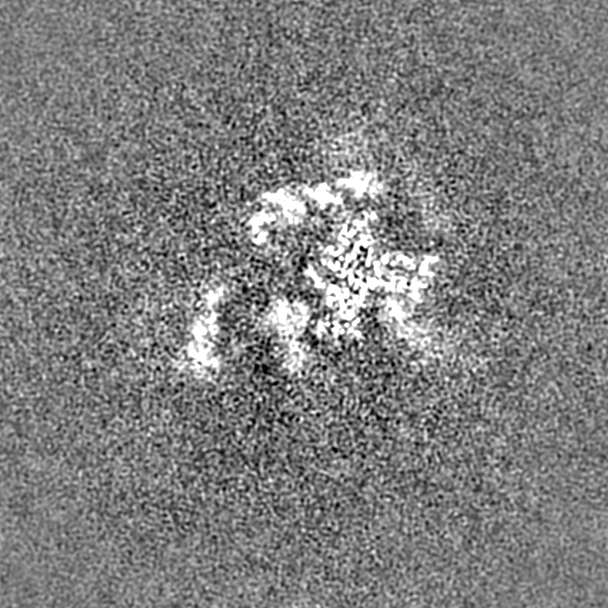
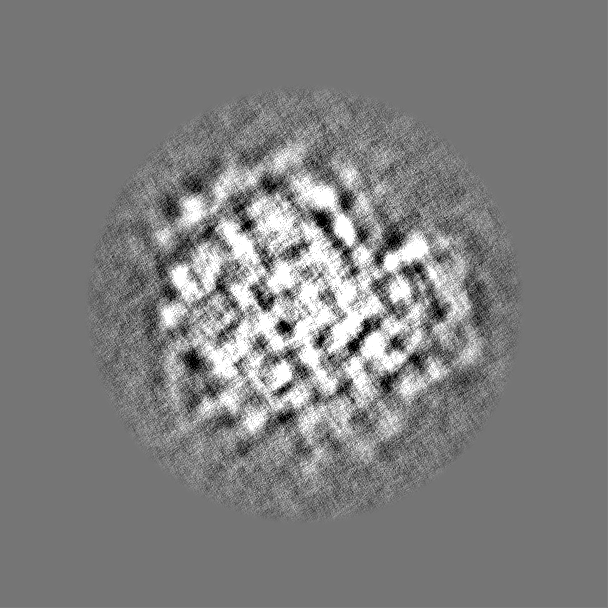
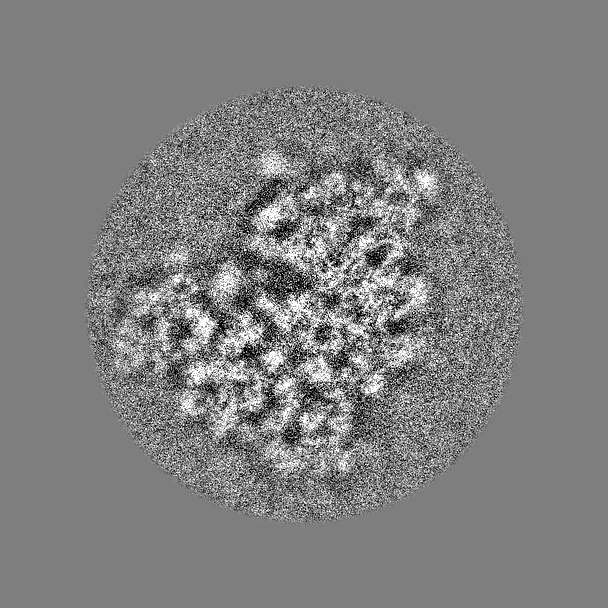
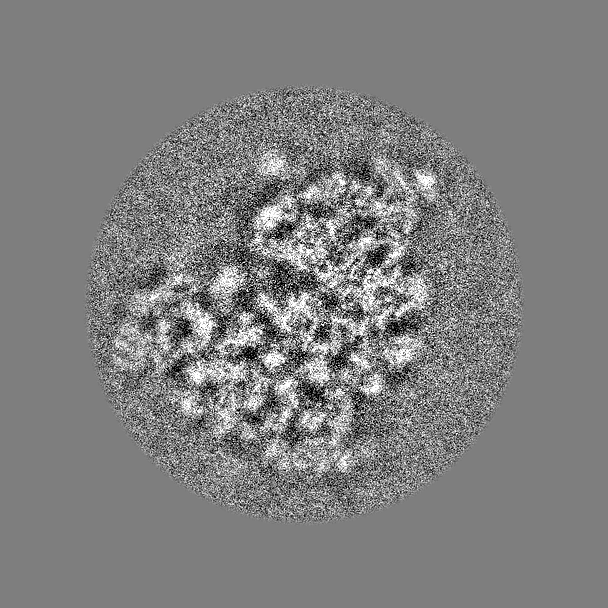
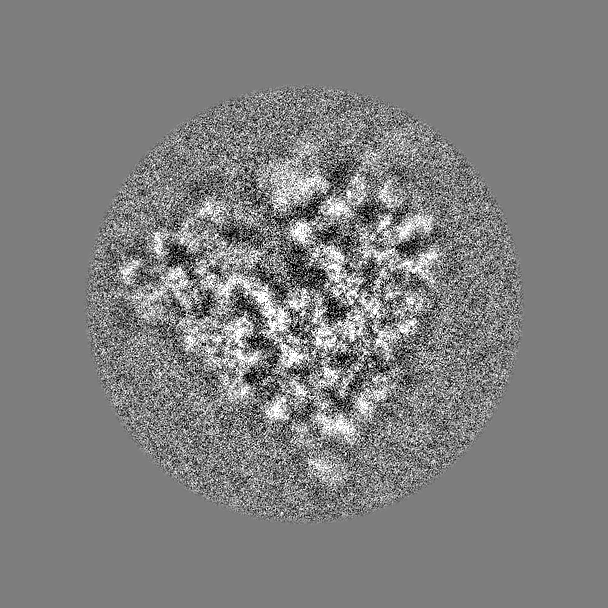
| Annotation | 80S ribosome with H13A angiogenin and tRNA | ||||||||||||||||||||||||||||||||||||
| Projections & slices | Image control
Images are generated by Spider. | ||||||||||||||||||||||||||||||||||||
| Voxel size | X=Y=Z: 0.83 Å | ||||||||||||||||||||||||||||||||||||
| Density |
| ||||||||||||||||||||||||||||||||||||
| Symmetry | Space group: 1 | ||||||||||||||||||||||||||||||||||||
| Details | EMDB XML:
|
 Z (Sec.)
 Y (Row.)
 X (Col.)


-Supplemental data
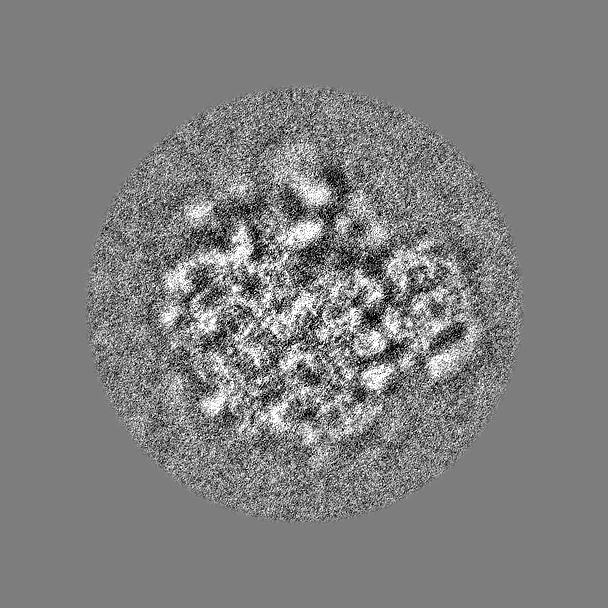
-Additional map: 80S ribosome with H13A angiogenin and tRNA, low-pass...
| File | emd_44460_additional_1.map | ||||||||||||
|---|---|---|---|---|---|---|---|---|---|---|---|---|---|
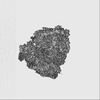
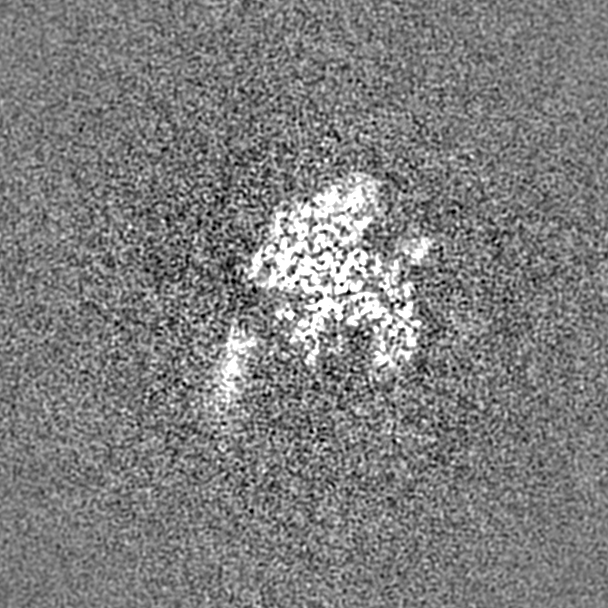
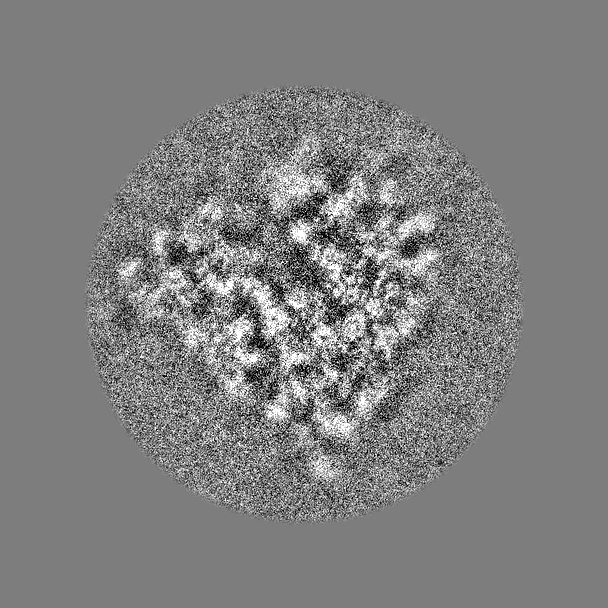
| Annotation | 80S ribosome with H13A angiogenin and tRNA, low-pass filtered to 5 A, used to visualize tRNA | ||||||||||||
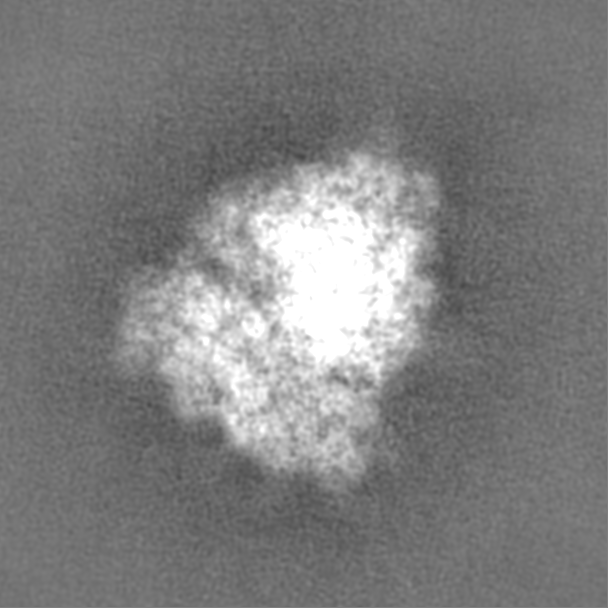
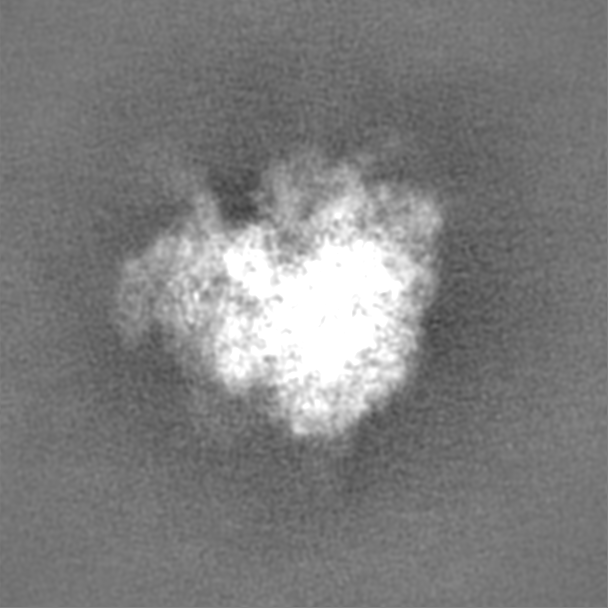
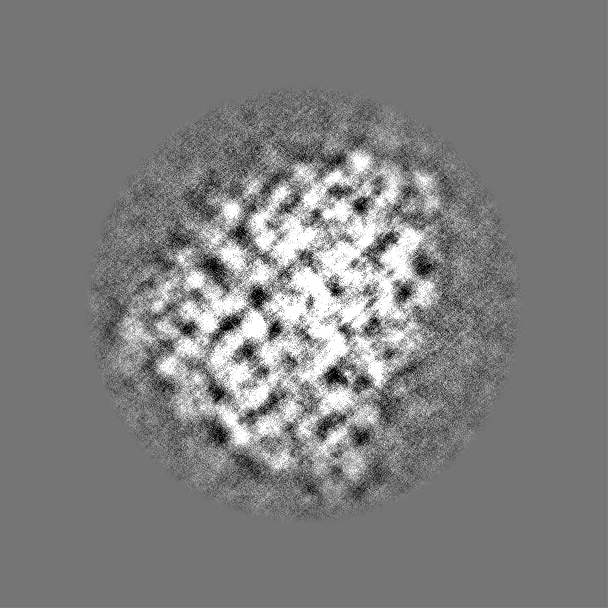
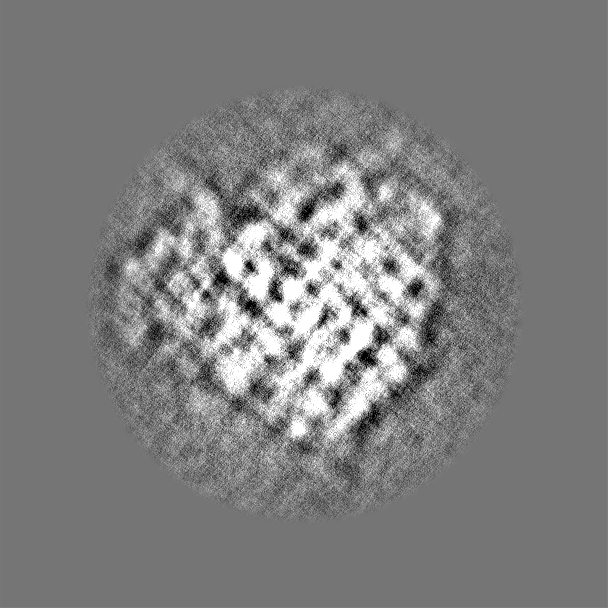
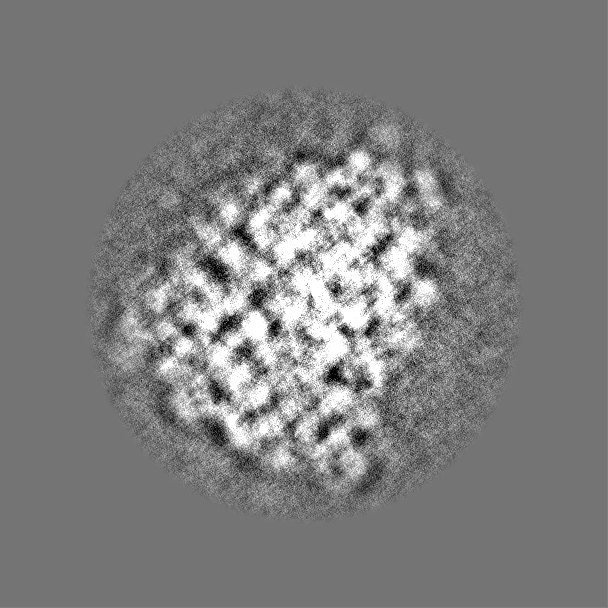
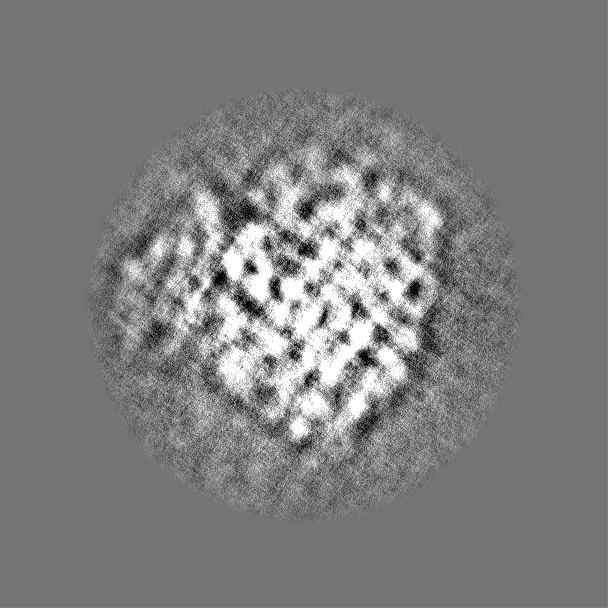
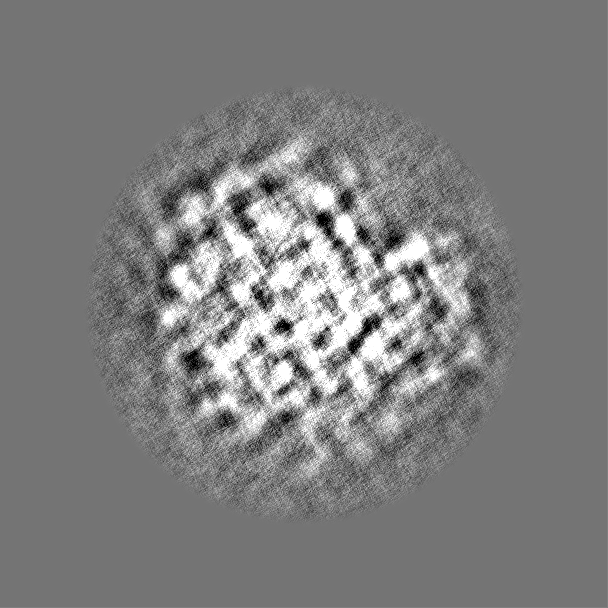
| Projections & Slices |
| ||||||||||||
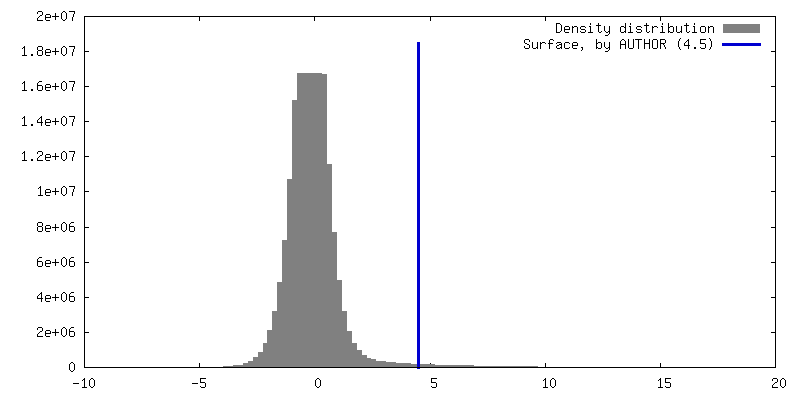
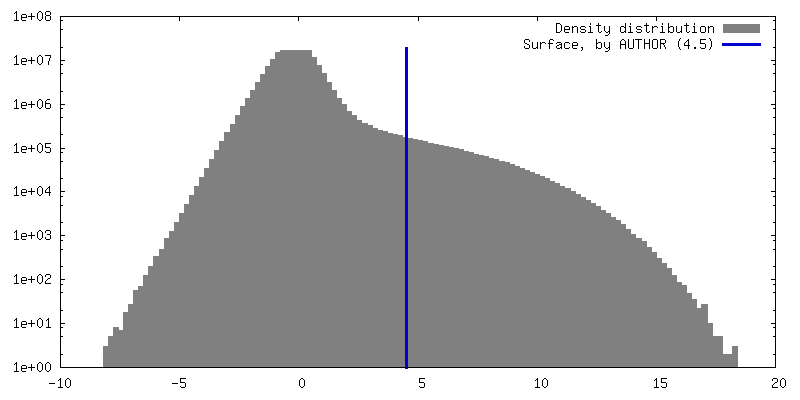
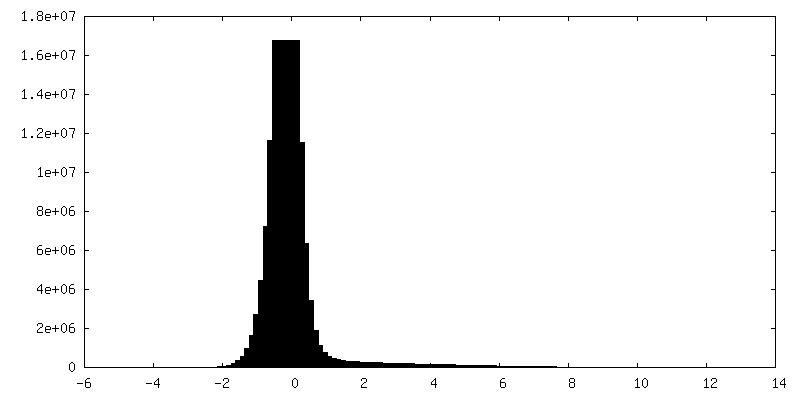
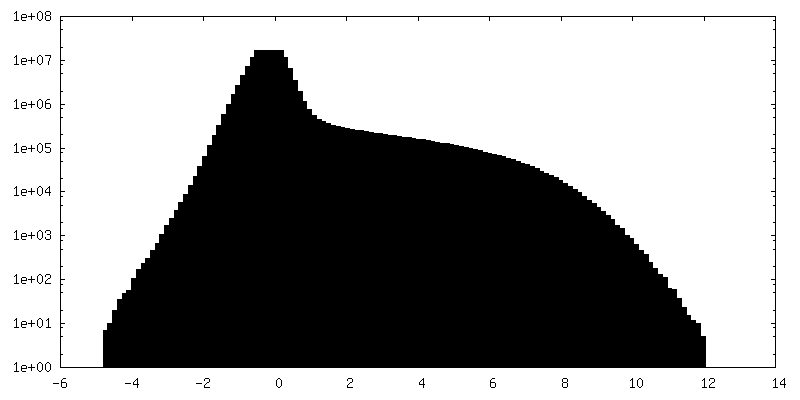
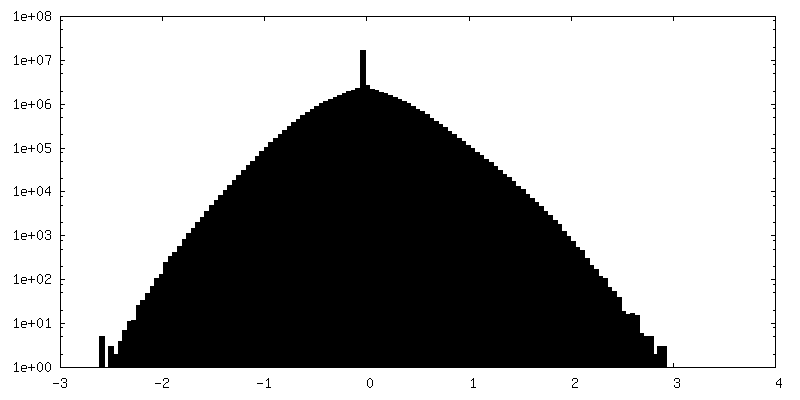
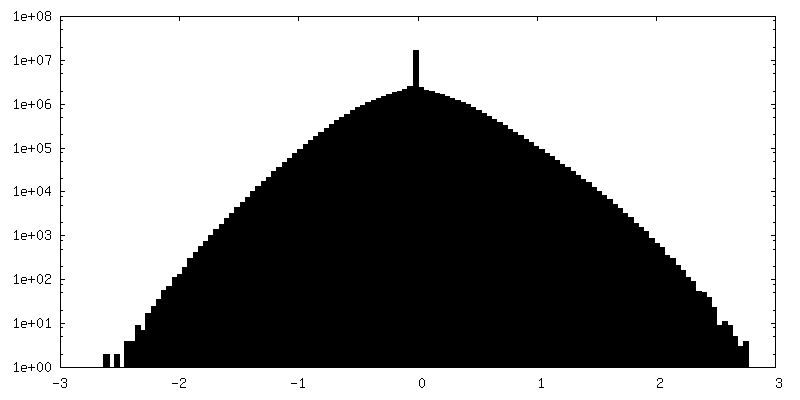
| Density Histograms |
-Half map: 80S ribosome with H13A angiogenin and tRNA, half map 1
| File | emd_44460_half_map_1.map | ||||||||||||
|---|---|---|---|---|---|---|---|---|---|---|---|---|---|
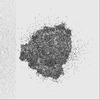
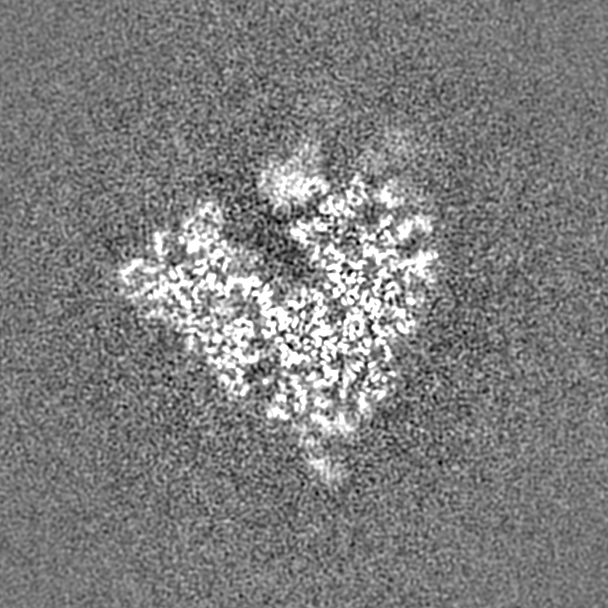
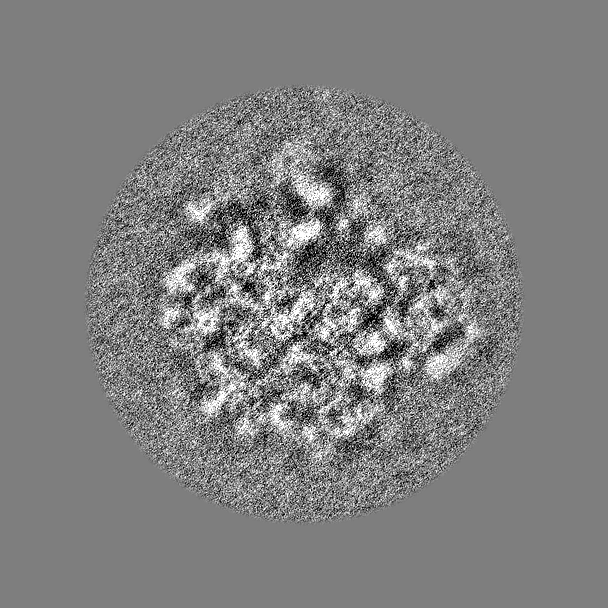
| Annotation | 80S ribosome with H13A angiogenin and tRNA, half map 1 | ||||||||||||
| Projections & Slices |
| ||||||||||||
| Density Histograms |

-Half map: 80S ribosome with H13A angiogenin and tRNA, half map 2
| File | emd_44460_half_map_2.map | ||||||||||||
|---|---|---|---|---|---|---|---|---|---|---|---|---|---|
| Annotation | 80S ribosome with H13A angiogenin and tRNA, half map 2 | ||||||||||||
| Projections & Slices |
| ||||||||||||
| Density Histograms |

- Sample components
-Entire : 80S ribosome with H13A angiogenin and tRNA
| Entire | Name: 80S ribosome with H13A angiogenin and tRNA |
|---|---|
| Components |
|
-Supramolecule #1: 80S ribosome with H13A angiogenin and tRNA
| Supramolecule | Name: 80S ribosome with H13A angiogenin and tRNA / type: complex / ID: 1 / Parent: 0 |
|---|---|
| Molecular weight | Theoretical: 4.5 MDa |
-Supramolecule #2: 80S ribosome
| Supramolecule | Name: 80S ribosome / type: complex / ID: 2 / Parent: 1 |
|---|---|
| Source (natural) | Organism: |
-Supramolecule #3: H13A angiogenin
| Supramolecule | Name: H13A angiogenin / type: complex / ID: 3 / Parent: 1 |
|---|---|
| Source (natural) | Organism: Homo sapiens (human) |
-Supramolecule #4: tRNA-fMet
| Supramolecule | Name: tRNA-fMet / type: complex / ID: 4 / Parent: 1 |
|---|---|
| Source (natural) | Organism: |
-Supramolecule #5: tRNA from in vitro transcription system
| Supramolecule | Name: tRNA from in vitro transcription system / type: complex / ID: 5 / Parent: 1 |
|---|---|
| Source (natural) | Organism: |
-Supramolecule #6: mRNA
| Supramolecule | Name: mRNA / type: complex / ID: 6 / Parent: 1 |
|---|---|
| Source (natural) | Organism: Homo sapiens (human) / Synthetically produced: Yes |
-Experimental details
-Structure determination
| Method | cryo EM |
|---|---|
 Processing Processing | single particle reconstruction |
| Aggregation state | particle |
-Sample preparation
| Buffer | pH: 7 |
|---|---|
| Grid | Model: Quantifoil R2/1 / Support film - Material: CARBON / Support film - topology: CONTINUOUS |
| Vitrification | Cryogen name: ETHANE / Chamber humidity: 95 % / Chamber temperature: 278 K / Instrument: FEI VITROBOT MARK IV |
- Electron microscopy
| Microscope | FEI TITAN KRIOS |
|---|---|
| Specialist optics | Energy filter - Name: GIF Bioquantum / Energy filter - Slit width: 20 eV |
| Image recording | Film or detector model: GATAN K3 BIOQUANTUM (6k x 4k) / Average electron dose: 30.0 e/Å2 |
| Electron beam | Acceleration voltage: 300 kV / Electron source:  FIELD EMISSION GUN FIELD EMISSION GUN |
| Electron optics | C2 aperture diameter: 100.0 µm / Illumination mode: FLOOD BEAM / Imaging mode: BRIGHT FIELD / Cs: 2.7 mm / Nominal defocus max: 2.1 µm / Nominal defocus min: 0.3 µm |
| Experimental equipment |  Model: Titan Krios / Image courtesy: FEI Company |