 Movie
Movie Controller


+ Open data

- Basic information
| Entry | Database: EMDB / ID: EMD-4377 | |||||||||
|---|---|---|---|---|---|---|---|---|---|---|
| Title | Tomogram obtained for yeast cells treated with rapamycin | |||||||||
 Map data Map data | Tomogram obtained for yeast cells treated with rapamycin | |||||||||
 Sample Sample |
| |||||||||
| Biological species |  | |||||||||
| Method | electron tomography / cryo EM | |||||||||
 Authors Authors | Pfeffer S / Engel BD / Schaffer M | |||||||||
 Citation Citation | Journal: Cell / Year: 2018 Title: mTORC1 Controls Phase Separation and the Biophysical Properties of the Cytoplasm by Tuning Crowding. Authors: M Delarue / G P Brittingham / S Pfeffer / I V Surovtsev / S Pinglay / K J Kennedy / M Schaffer / J I Gutierrez / D Sang / G Poterewicz / J K Chung / J M Plitzko / J T Groves / C Jacobs- ...Authors: M Delarue / G P Brittingham / S Pfeffer / I V Surovtsev / S Pinglay / K J Kennedy / M Schaffer / J I Gutierrez / D Sang / G Poterewicz / J K Chung / J M Plitzko / J T Groves / C Jacobs-Wagner / B D Engel / L J Holt /   Abstract: Macromolecular crowding has a profound impact on reaction rates and the physical properties of the cell interior, but the mechanisms that regulate crowding are poorly understood. We developed ...Macromolecular crowding has a profound impact on reaction rates and the physical properties of the cell interior, but the mechanisms that regulate crowding are poorly understood. We developed genetically encoded multimeric nanoparticles (GEMs) to dissect these mechanisms. GEMs are homomultimeric scaffolds fused to a fluorescent protein that self-assemble into bright, stable particles of defined size and shape. By combining tracking of GEMs with genetic and pharmacological approaches, we discovered that the mTORC1 pathway can modulate the effective diffusion coefficient of particles ≥20 nm in diameter more than 2-fold by tuning ribosome concentration, without any discernable effect on the motion of molecules ≤5 nm. This change in ribosome concentration affected phase separation both in vitro and in vivo. Together, these results establish a role for mTORC1 in controlling both the mesoscale biophysical properties of the cytoplasm and biomolecular condensation. | |||||||||
| History |
|
- Structure visualization
| Movie |
 Movie viewer Movie viewer |
|---|---|
| Supplemental images |

- Downloads & links
-EMDB archive
| Map data | emd_4377.map.gz | 1.1 GB | EMDB map data format | |
|---|---|---|---|---|
| Header (meta data) | emd-4377-v30.xmlemd-4377.xml | 10.9 KB 10.9 KB | Display Display | EMDB header |
| Images | 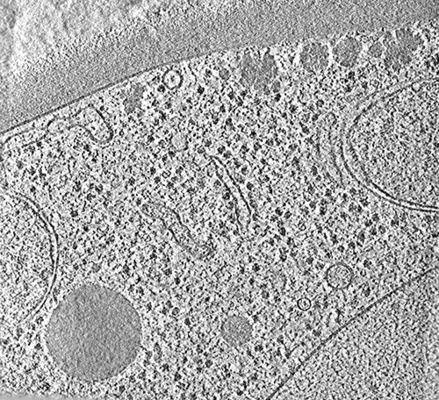 emd_4377.png emd_4377.png | 195.9 KB | ||
| Archive directory |  http://ftp.pdbj.org/pub/emdb/structures/EMD-4377ftp://ftp.pdbj.org/pub/emdb/structures/EMD-4377 http://ftp.pdbj.org/pub/emdb/structures/EMD-4377ftp://ftp.pdbj.org/pub/emdb/structures/EMD-4377 | HTTPS FTP |
-Related structure data

-Links
| EMDB pages | EMDB (EBI/PDBe) / EMDataResource |
|---|
-Map
| File | Download / File: emd_4377.map.gz / Format: CCP4 / Size: 1.2 GB / Type: IMAGE STORED AS FLOATING POINT NUMBER (4 BYTES) | ||||||||||||||||||||||||||||||||||||||||||||||||||||||||||||
|---|---|---|---|---|---|---|---|---|---|---|---|---|---|---|---|---|---|---|---|---|---|---|---|---|---|---|---|---|---|---|---|---|---|---|---|---|---|---|---|---|---|---|---|---|---|---|---|---|---|---|---|---|---|---|---|---|---|---|---|---|---|
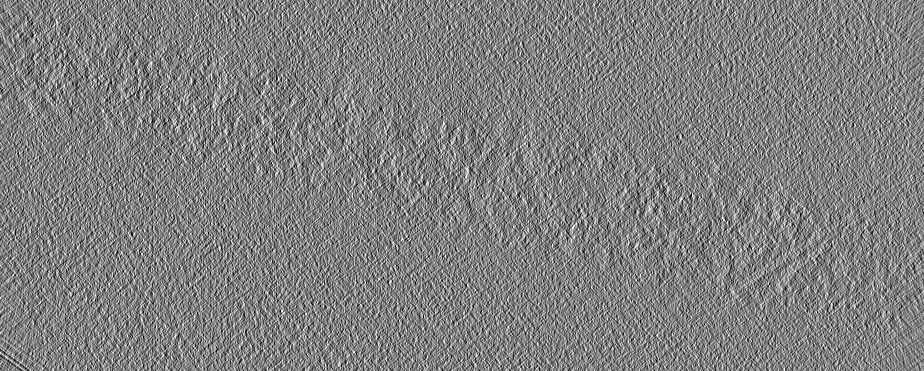
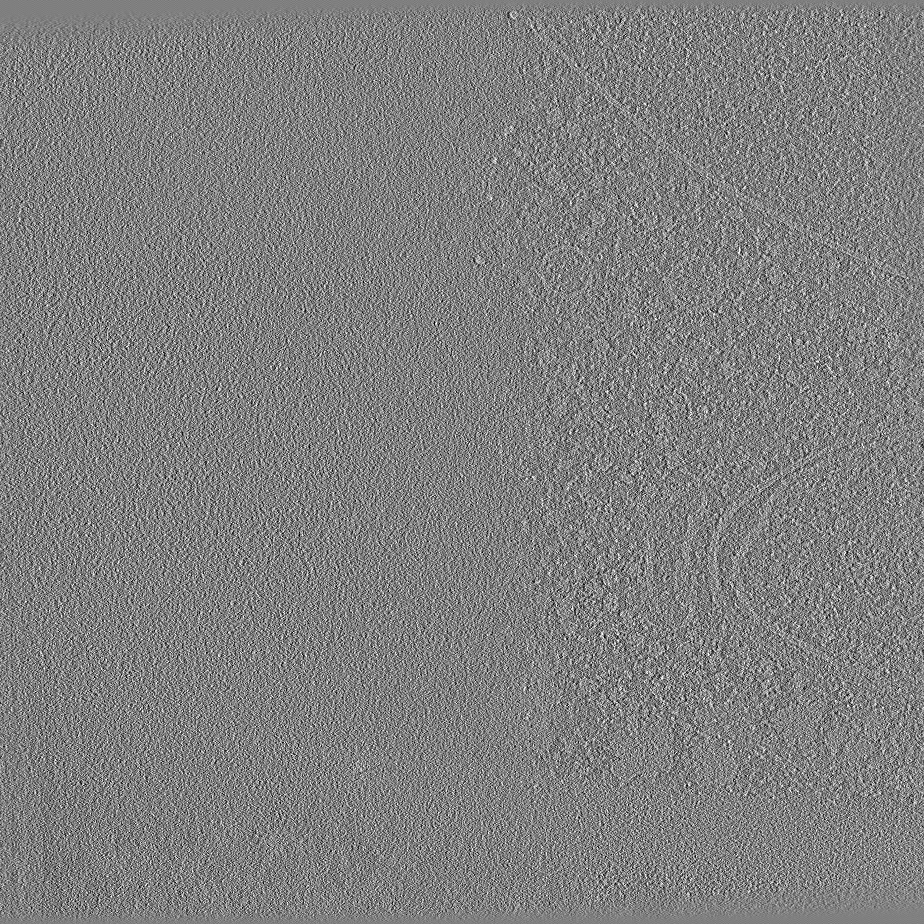
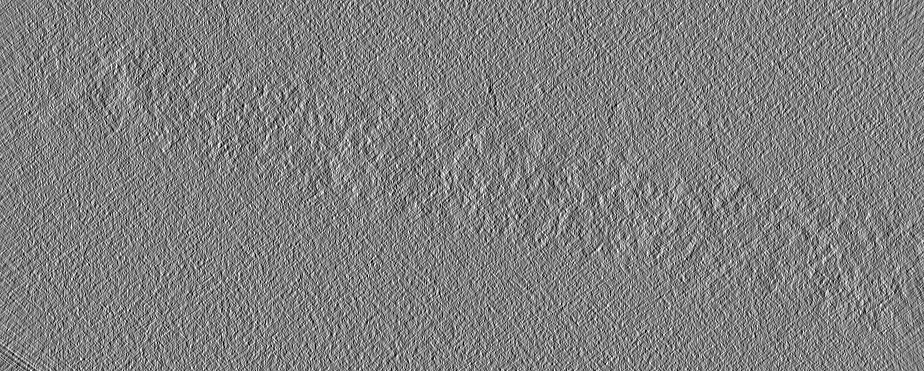
| Annotation | Tomogram obtained for yeast cells treated with rapamycin | ||||||||||||||||||||||||||||||||||||||||||||||||||||||||||||
| Projections & slices | Image control
Images are generated by Spider. generated in cubic-lattice coordinate | ||||||||||||||||||||||||||||||||||||||||||||||||||||||||||||
| Voxel size | X=Y=Z: 13.68 Å | ||||||||||||||||||||||||||||||||||||||||||||||||||||||||||||
| Density |
| ||||||||||||||||||||||||||||||||||||||||||||||||||||||||||||
| Symmetry | Space group: 1 | ||||||||||||||||||||||||||||||||||||||||||||||||||||||||||||
| Details | EMDB XML:
CCP4 map header:
| ||||||||||||||||||||||||||||||||||||||||||||||||||||||||||||
 Z (Sec.)
 Y (Row.)
 X (Col.)


-Supplemental data
- Sample components
-Entire : Yeast cell treated with rapamycin
| Entire | Name: Yeast cell treated with rapamycin |
|---|---|
| Components |
|
-Supramolecule #1: Yeast cell treated with rapamycin
| Supramolecule | Name: Yeast cell treated with rapamycin / type: cell / ID: 1 / Parent: 0 |
|---|---|
| Source (natural) | Organism: |
-Experimental details
-Structure determination
| Method | cryo EM |
|---|---|
 Processing Processing | electron tomography |
| Aggregation state | cell |
-Sample preparation
| Buffer | pH: 7 |
|---|---|
| Grid | Model: Quantifoil R2/1 / Material: COPPER / Support film - Material: CARBON / Support film - topology: HOLEY |
| Vitrification | Cryogen name: ETHANE-PROPANE / Instrument: FEI VITROBOT MARK IV / Details: 10 seconds blot time, blot force 10. |
| Details | Rapamycin-treated yeast cell thinned by focused ion beam milling |
| Sectioning | Focused ion beam - Instrument: OTHER / Focused ion beam - Ion: OTHER / Focused ion beam - Voltage: 30 kV / Focused ion beam - Current: 0.3 nA / Focused ion beam - Dose rate: 3.3 / Focused ion beam - Duration: 3500 sec. / Focused ion beam - Temperature: 92 K / Focused ion beam - Initial thickness: 10000 / Focused ion beam - Final thickness: 150 Focused ion beam - Details: 3.3E14 ions x cm-2 x s-1. The value given for _emd_sectioning_focused_ion_beam.instrument is FEI Quanta FIB. This is not in a list of allowed values set(['DB235', 'OTHER']) ...Focused ion beam - Details: 3.3E14 ions x cm-2 x s-1. The value given for _emd_sectioning_focused_ion_beam.instrument is FEI Quanta FIB. This is not in a list of allowed values set(['DB235', 'OTHER']) so OTHER is written into the XML file. |
- Electron microscopy
| Microscope | FEI TITAN KRIOS |
|---|---|
| Image recording | Film or detector model: GATAN K2 SUMMIT (4k x 4k) / Detector mode: COUNTING / Average electron dose: 1.5 e/Å2 |
| Electron beam | Acceleration voltage: 300 kV / Electron source:  FIELD EMISSION GUN FIELD EMISSION GUN |
| Electron optics | Illumination mode: FLOOD BEAM / Imaging mode: BRIGHT FIELD / Nominal defocus max: 6.0 µm / Nominal defocus min: 6.0 µm |
| Sample stage | Specimen holder model: FEI TITAN KRIOS AUTOGRID HOLDER / Cooling holder cryogen: NITROGEN |
| Experimental equipment |  Model: Titan Krios / Image courtesy: FEI Company |
-Image processing
| Final reconstruction | Algorithm: BACK PROJECTION / Software - Name: IMOD / Number images used: 61 |
|---|
