 Movie
Movie Controller


+ Open data

- Basic information
| Entry |  | |||||||||
|---|---|---|---|---|---|---|---|---|---|---|
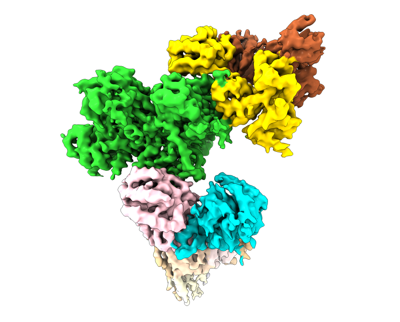
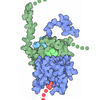
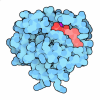
| Title | GATOR1-RAG-RAGULATOR - Inhibitory Complex | |||||||||
 Map data Map data | GATOR1-RAG-RAGULATOR - Inhibitory Complex | |||||||||
 Sample Sample |
| |||||||||
 Keywords Keywords | Complex / GTPase activating protein / nutrient sensing / metabolism / HYDROLASE | |||||||||
| Function / homology |  Function and homology information Function and homology informationGATOR1 complex / negative regulation of kinase activity / regulation of cholesterol import / positive regulation of protein localization to lysosome / regulation of cell-substrate junction organization / regulation of cholesterol efflux / Gtr1-Gtr2 GTPase complex / FNIP-folliculin RagC/D GAP / Ragulator complex / protein localization to cell junction ...GATOR1 complex / negative regulation of kinase activity / regulation of cholesterol import / positive regulation of protein localization to lysosome / regulation of cell-substrate junction organization / regulation of cholesterol efflux / Gtr1-Gtr2 GTPase complex / FNIP-folliculin RagC/D GAP / Ragulator complex / protein localization to cell junction / aorta morphogenesis / regulation of TORC1 signaling / protein localization to lysosome / fibroblast migration / lysosome localization / MTOR signalling / regulation of TOR signaling / Energy dependent regulation of mTOR by LKB1-AMPK / endosome organization / Amino acids regulate mTORC1 / kinase activator activity / cardiac muscle tissue development / protein localization to membrane / vacuolar membrane / ventricular septum development / azurophil granule membrane / endosomal transport / regulation of cell size / small GTPase-mediated signal transduction / lysosome organization / Macroautophagy / RHOJ GTPase cycle / RHOQ GTPase cycle / roof of mouth development / TORC1 signaling / CDC42 GTPase cycle / tertiary granule membrane / RHOG GTPase cycle / response to amino acid / RHOH GTPase cycle / regulation of receptor recycling / mTORC1-mediated signalling / ficolin-1-rich granule membrane / RAC3 GTPase cycle / RAC2 GTPase cycle / positive regulation of TOR signaling / enzyme-substrate adaptor activity / specific granule membrane / RAC1 GTPase cycle / negative regulation of TORC1 signaling / protein-membrane adaptor activity / positive regulation of TORC1 signaling / positive regulation of autophagy / cellular response to nutrient levels / guanyl-nucleotide exchange factor activity / RNA splicing / viral genome replication / cholesterol homeostasis / cellular response to amino acid starvation / cellular response to starvation / Regulation of PTEN gene transcription / tumor necrosis factor-mediated signaling pathway / negative regulation of autophagy / positive regulation of interleukin-8 production / GTPase activator activity / TP53 Regulates Metabolic Genes / cellular response to amino acid stimulus / phosphoprotein binding / regulation of cell growth / MAP2K and MAPK activation / positive regulation of protein localization to nucleus / small GTPase binding / response to virus / intracellular protein localization / late endosome / GDP binding / late endosome membrane / glucose homeostasis / E3 ubiquitin ligases ubiquitinate target proteins / GTPase binding / molecular adaptor activity / Hydrolases; Acting on acid anhydrides; Acting on GTP to facilitate cellular and subcellular movement / positive regulation of MAPK cascade / positive regulation of canonical NF-kappaB signal transduction / lysosome / endosome membrane / intracellular signal transduction / membrane raft / protein heterodimerization activity / lysosomal membrane / focal adhesion / GTPase activity / apoptotic process / Neutrophil degranulation / ubiquitin protein ligase binding / positive regulation of gene expression / negative regulation of apoptotic process / GTP binding / protein-containing complex binding / perinuclear region of cytoplasm Similarity search - Function | |||||||||
| Biological species |  Homo sapiens (human) Homo sapiens (human) | |||||||||
| Method | single particle reconstruction / cryo EM / Resolution: 4.0 Å | |||||||||
 Authors Authors | Egri SB / Shen K | |||||||||
| Funding support |  United States, 1 items United States, 1 items
| |||||||||
 Citation Citation | Journal: Mol Cell / Year: 2022 Title: Cryo-EM structures of the human GATOR1-Rag-Ragulator complex reveal a spatial-constraint regulated GAP mechanism. Authors: Shawn B Egri / Christna Ouch / Hui-Ting Chou / Zhiheng Yu / Kangkang Song / Chen Xu / Kuang Shen / Abstract: mTORC1 controls cellular metabolic processes in response to nutrient availability. Amino acid signals are transmitted to mTORC1 through the Rag GTPases, which are localized on the lysosomal surface ...mTORC1 controls cellular metabolic processes in response to nutrient availability. Amino acid signals are transmitted to mTORC1 through the Rag GTPases, which are localized on the lysosomal surface by the Ragulator complex. The Rag GTPases receive amino acid signals from multiple upstream regulators. One negative regulator, GATOR1, is a GTPase activating protein (GAP) for RagA. GATOR1 binds to the Rag GTPases via two modes: an inhibitory mode and a GAP mode. How these two binding interactions coordinate to process amino acid signals is unknown. Here, we resolved three cryo-EM structural models of the GATOR1-Rag-Ragulator complex, with the Rag-Ragulator subcomplex occupying the inhibitory site, the GAP site, and both binding sites simultaneously. When the Rag GTPases bind to GATOR1 at the GAP site, both Rag subunits contact GATOR1 to coordinate their nucleotide loading states. These results reveal a potential GAP mechanism of GATOR1 during the mTORC1 inactivation process. | |||||||||
| History |
|
- Structure visualization
| Supplemental images |
|---|
- Downloads & links
-EMDB archive
| Map data | emd_25652.map.gz | 306.8 MB | EMDB map data format | |
|---|---|---|---|---|
| Header (meta data) | emd-25652-v30.xmlemd-25652.xml | 25.3 KB 25.3 KB | Display Display | EMDB header |
| Images |  emd_25652.png emd_25652.png | 86.8 KB | ||
| Filedesc metadata | emd-25652.cif.gz | 8.7 KB | ||
| Archive directory |  http://ftp.pdbj.org/pub/emdb/structures/EMD-25652ftp://ftp.pdbj.org/pub/emdb/structures/EMD-25652 http://ftp.pdbj.org/pub/emdb/structures/EMD-25652ftp://ftp.pdbj.org/pub/emdb/structures/EMD-25652 | HTTPS FTP |
-Related structure data
| Related structure data |  7t3aMC  7t3bC  7t3cC M: atomic model generated by this map C: citing same article ( |
|---|---|
| Similar structure data |


-Links
| EMDB pages | EMDB (EBI/PDBe) / EMDataResource |
|---|---|
| Related items in Molecule of the Month |
-Map
| File | Download / File: emd_25652.map.gz / Format: CCP4 / Size: 325 MB / Type: IMAGE STORED AS FLOATING POINT NUMBER (4 BYTES) | ||||||||||||||||||||||||||||||||||||
|---|---|---|---|---|---|---|---|---|---|---|---|---|---|---|---|---|---|---|---|---|---|---|---|---|---|---|---|---|---|---|---|---|---|---|---|---|---|
| Annotation | GATOR1-RAG-RAGULATOR - Inhibitory Complex | ||||||||||||||||||||||||||||||||||||
| Projections & slices | Image control
Images are generated by Spider. | ||||||||||||||||||||||||||||||||||||
| Voxel size | X=Y=Z: 0.655 Å | ||||||||||||||||||||||||||||||||||||
| Density |
| ||||||||||||||||||||||||||||||||||||
| Symmetry | Space group: 1 | ||||||||||||||||||||||||||||||||||||
| Details | EMDB XML:
|
 Z (Sec.)
 Y (Row.)
 X (Col.)


-Supplemental data
- Sample components
+Entire : GATOR1-RAG-RAGULATOR - Inhibitory Complex
+Supramolecule #1: GATOR1-RAG-RAGULATOR - Inhibitory Complex
+Macromolecule #1: GATOR complex protein DEPDC5
+Macromolecule #2: GATOR complex protein NPRL2
+Macromolecule #3: GATOR complex protein NPRL3
+Macromolecule #4: Ras-related GTP-binding protein A
+Macromolecule #5: Ras-related GTP-binding protein C
+Macromolecule #6: Ragulator complex protein LAMTOR1
+Macromolecule #7: Ragulator complex protein LAMTOR2
+Macromolecule #8: Ragulator complex protein LAMTOR3
+Macromolecule #9: Ragulator complex protein LAMTOR4
+Macromolecule #10: Ragulator complex protein LAMTOR5
+Macromolecule #11: PHOSPHOAMINOPHOSPHONIC ACID-GUANYLATE ESTER
-Experimental details
-Structure determination
| Method | cryo EM |
|---|---|
 Processing Processing | single particle reconstruction |
| Aggregation state | particle |
-Sample preparation
| Buffer | pH: 7.4 |
|---|---|
| Vitrification | Cryogen name: ETHANE |
- Electron microscopy
| Microscope | FEI TITAN KRIOS |
|---|---|
| Image recording | Film or detector model: GATAN K2 SUMMIT (4k x 4k) / Average electron dose: 58.3 e/Å2 |
| Electron beam | Acceleration voltage: 300 kV / Electron source:  FIELD EMISSION GUN FIELD EMISSION GUN |
| Electron optics | Illumination mode: FLOOD BEAM / Imaging mode: BRIGHT FIELD / Nominal defocus max: -3.5 µm / Nominal defocus min: -1.0 µm |
| Experimental equipment |  Model: Titan Krios / Image courtesy: FEI Company |
