 Movie
Movie Controller

[English] 日本語
 Yorodumi
- EMDB-15709: Structure of a nucleosome-bound MuvB transcription factor complex... -
+ Open data

- Basic information
| Entry |  | |||||||||
|---|---|---|---|---|---|---|---|---|---|---|
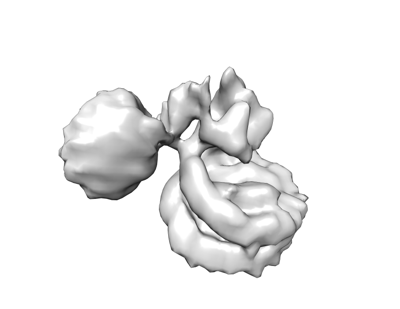
| Title | Structure of a nucleosome-bound MuvB transcription factor complex reveals DNA remodelling | |||||||||
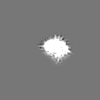
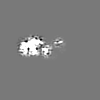
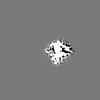
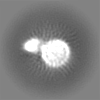
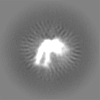
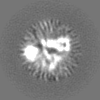
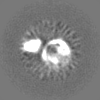
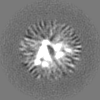
 Map data Map data | MMBcore:NCP overall refined map at 10 Angstrom resolution | |||||||||
 Sample Sample |
| |||||||||
| Biological species |  Homo sapiens (human) Homo sapiens (human) | |||||||||
| Method | single particle reconstruction / cryo EM / Resolution: 10.0 Å | |||||||||
 Authors Authors | Alfieri C | |||||||||
| Funding support |  United Kingdom, 1 items United Kingdom, 1 items
| |||||||||
 Citation Citation | Journal: Nat Commun / Year: 2022 Title: Structure of a nucleosome-bound MuvB transcription factor complex reveals DNA remodelling. Authors: Marios G Koliopoulos / Reyhan Muhammad / Theodoros I Roumeliotis / Fabienne Beuron / Jyoti S Choudhary / Claudio Alfieri / Abstract: Genes encoding the core cell cycle machinery are transcriptionally regulated by the MuvB family of protein complexes in a cell cycle-specific manner. Complexes of MuvB with the transcription factors ...Genes encoding the core cell cycle machinery are transcriptionally regulated by the MuvB family of protein complexes in a cell cycle-specific manner. Complexes of MuvB with the transcription factors B-MYB and FOXM1 activate mitotic genes during cell proliferation. The mechanisms of transcriptional regulation by these complexes are still poorly characterised. Here, we combine biochemical analysis and in vitro reconstitution, with structural analysis by cryo-electron microscopy and cross-linking mass spectrometry, to functionally examine these complexes. We find that the MuvB:B-MYB complex binds and remodels nucleosomes, thereby exposing nucleosomal DNA. This remodelling activity is supported by B-MYB which directly binds the remodelled DNA. Given the remodelling activity on the nucleosome, we propose that the MuvB:B-MYB complex functions as a pioneer transcription factor complex. In this work, we rationalise prior biochemical and cellular studies and provide a molecular framework of interactions on a protein complex that is key for cell cycle regulation. | |||||||||
| History |
|
- Structure visualization
| Supplemental images |
|---|
- Downloads & links
-EMDB archive
| Map data | emd_15709.map.gz | 2.7 MB |  EMDB map data format EMDB map data format | |
|---|---|---|---|---|
| Header (meta data) | emd-15709-v30.xmlemd-15709.xml | 26.9 KB 26.9 KB | Display Display | EMDB header |
| Images |  emd_15709.png emd_15709.png | 33.9 KB | ||
| Others | emd_15709_additional_1.map.gzemd_15709_additional_2.map.gzemd_15709_additional_3.map.gzemd_15709_additional_4.map.gzemd_15709_additional_5.map.gzemd_15709_additional_6.map.gzemd_15709_additional_7.map.gzemd_15709_half_map_1.map.gzemd_15709_half_map_2.map.gz | 156.7 KB 2.9 MB 178.5 KB 3 MB 93.7 KB 29.5 MB 142.8 KB 2.7 MB 2.7 MB | ||
| Archive directory |  http://ftp.pdbj.org/pub/emdb/structures/EMD-15709ftp://ftp.pdbj.org/pub/emdb/structures/EMD-15709 http://ftp.pdbj.org/pub/emdb/structures/EMD-15709ftp://ftp.pdbj.org/pub/emdb/structures/EMD-15709 | HTTPS FTP |
-Related structure data


-Links
| EMDB pages | EMDB (EBI/PDBe) / EMDataResource |
|---|
-Map
| File | Download / File: emd_15709.map.gz / Format: CCP4 / Size: 3.8 MB / Type: IMAGE STORED AS FLOATING POINT NUMBER (4 BYTES) | ||||||||||||||||||||||||||||||||||||
|---|---|---|---|---|---|---|---|---|---|---|---|---|---|---|---|---|---|---|---|---|---|---|---|---|---|---|---|---|---|---|---|---|---|---|---|---|---|
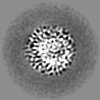
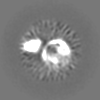
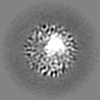
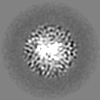
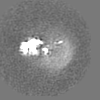
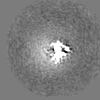
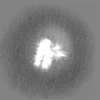
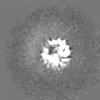
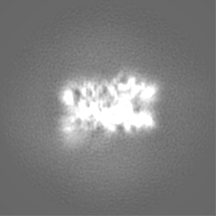
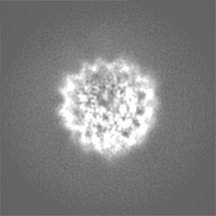
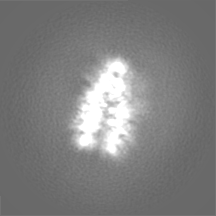
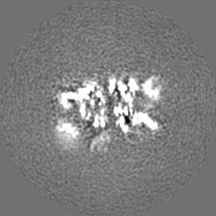
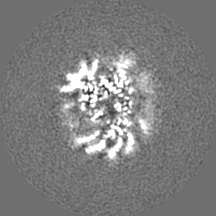
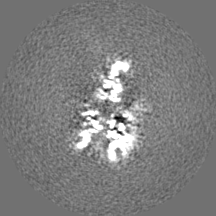
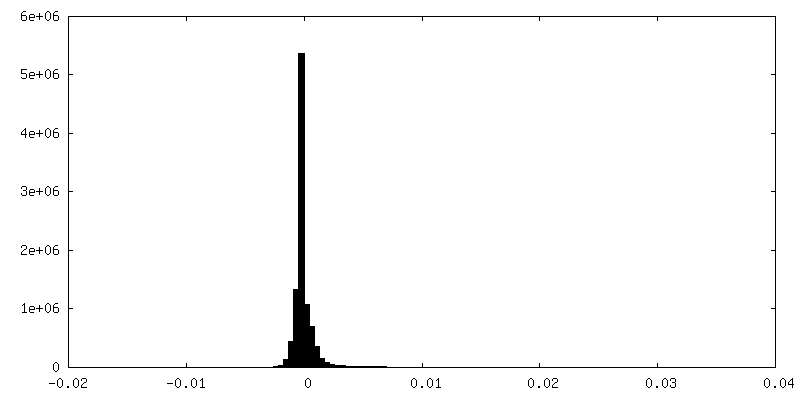
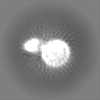
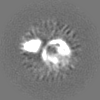
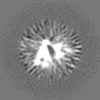
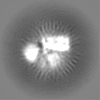
| Annotation | MMBcore:NCP overall refined map at 10 Angstrom resolution | ||||||||||||||||||||||||||||||||||||
| Projections & slices | Image control
Images are generated by Spider. | ||||||||||||||||||||||||||||||||||||
| Voxel size | X=Y=Z: 3.4884 Å | ||||||||||||||||||||||||||||||||||||
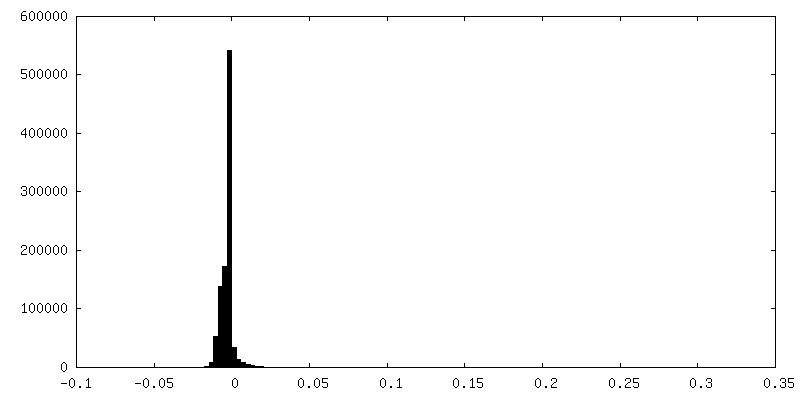
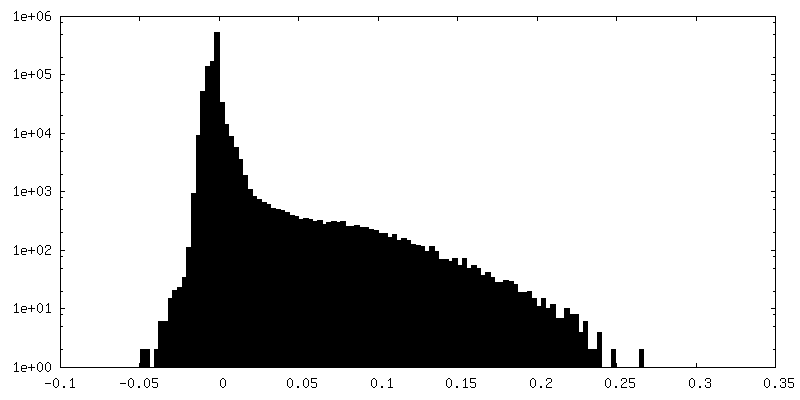
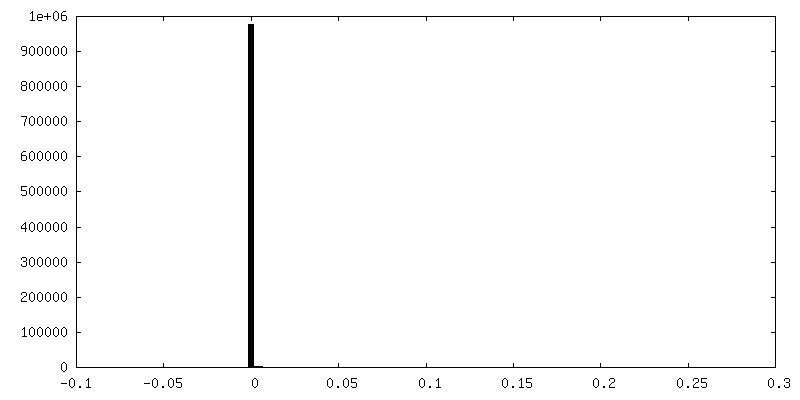
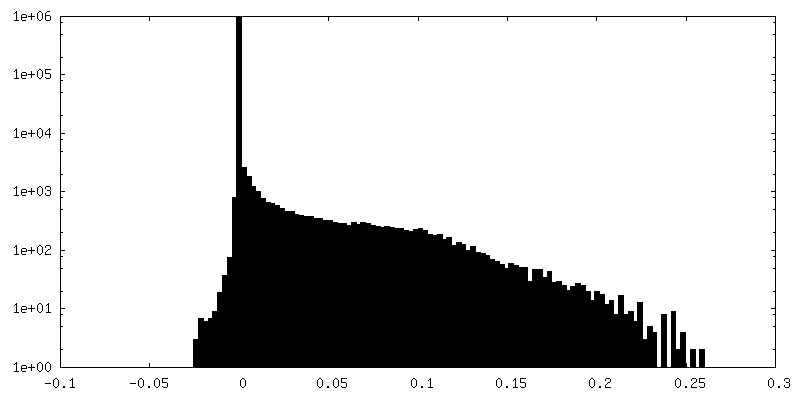
| Density |
| ||||||||||||||||||||||||||||||||||||
| Symmetry | Space group: 1 | ||||||||||||||||||||||||||||||||||||
| Details | EMDB XML:
|
 Z (Sec.)
 Y (Row.)
 X (Col.)


-Supplemental data
-Additional map: MMB:DNA local refined map at 7.5 Angstrom resolution, sharpened more
| File | emd_15709_additional_1.map | ||||||||||||
|---|---|---|---|---|---|---|---|---|---|---|---|---|---|
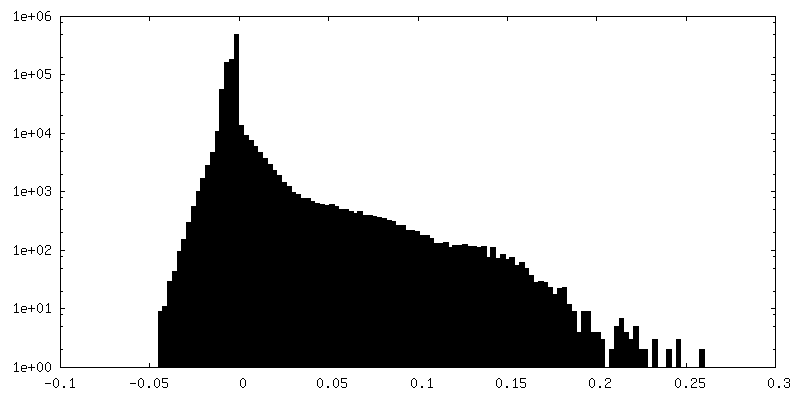
| Annotation | MMB:DNA local refined map at 7.5 Angstrom resolution, sharpened more | ||||||||||||
| Projections & Slices |
| ||||||||||||
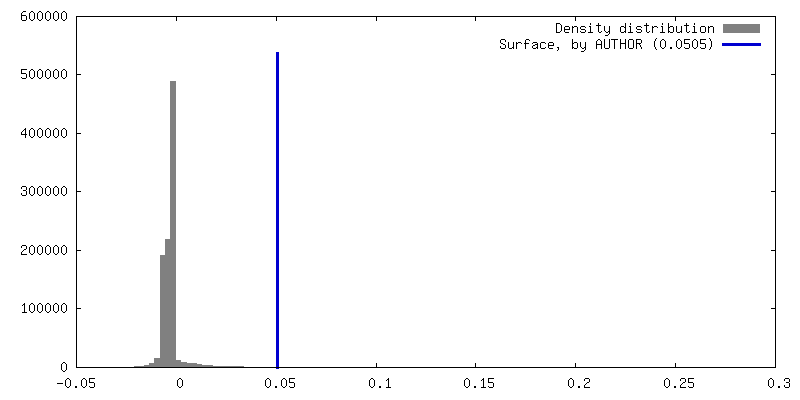
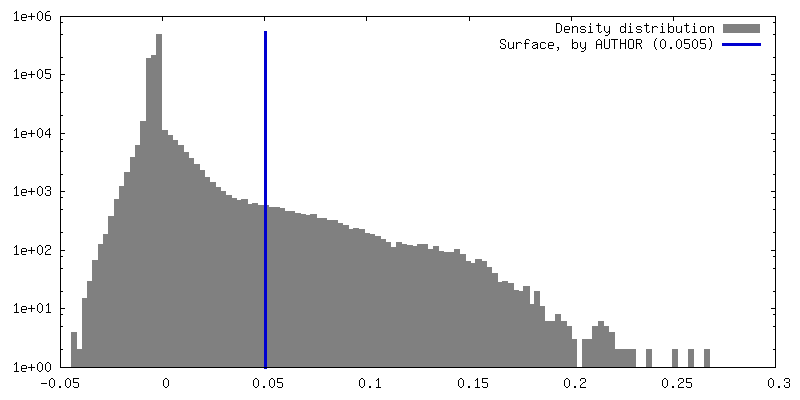
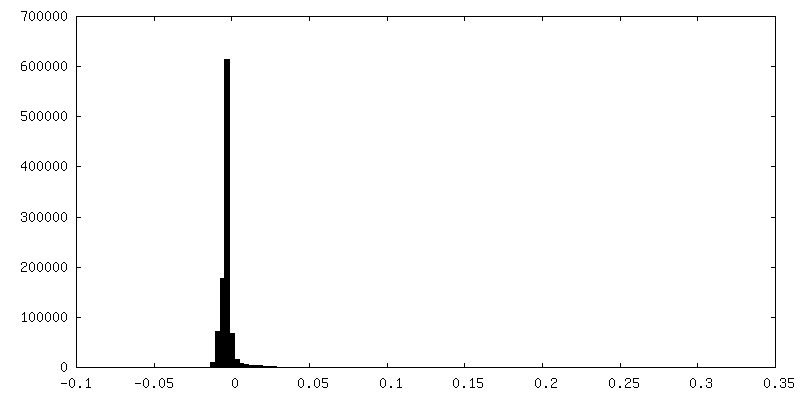
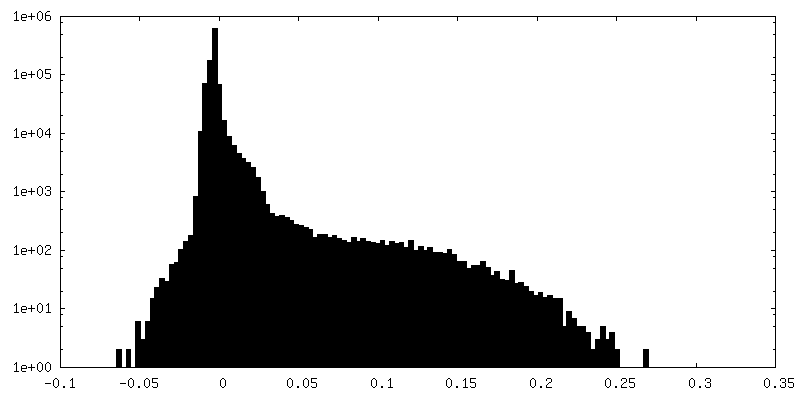
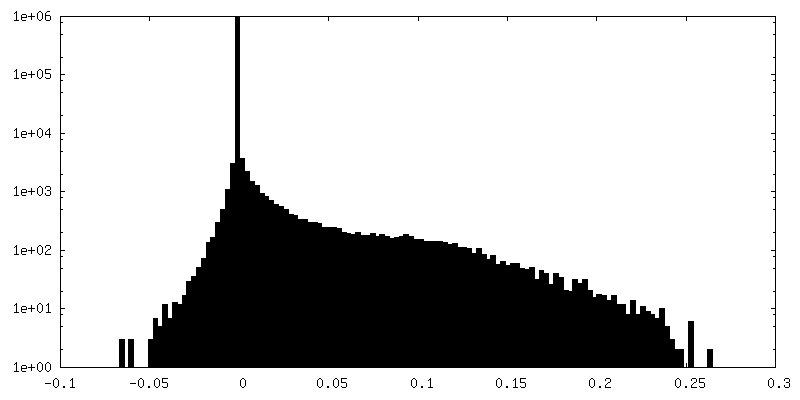
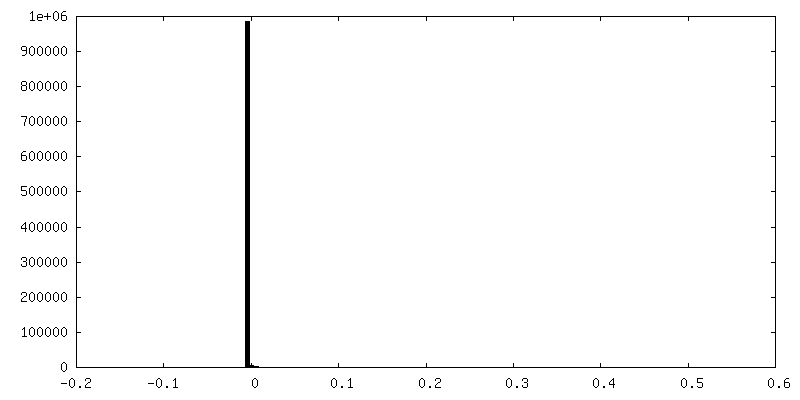
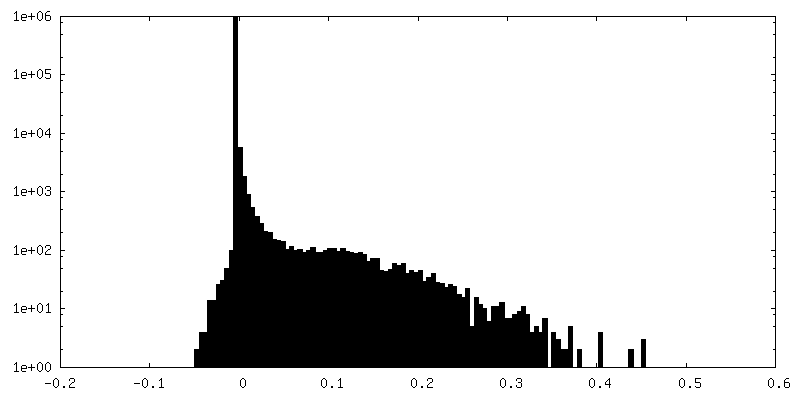
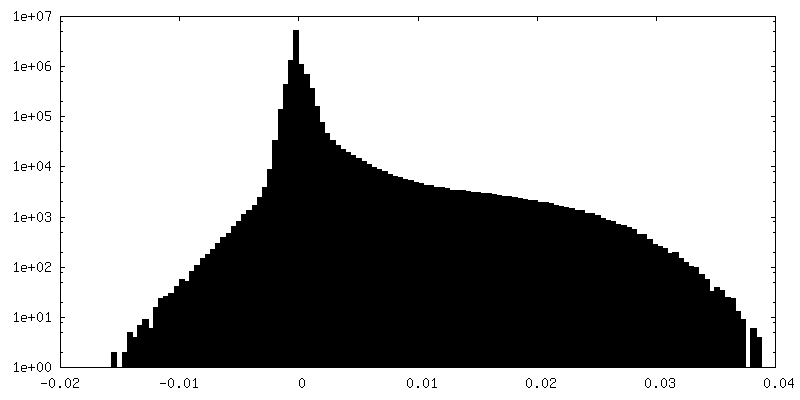
| Density Histograms |


-Additional map: MMB:DNA local refined map at 7.5 Angstrom resolution
| File | emd_15709_additional_2.map | ||||||||||||
|---|---|---|---|---|---|---|---|---|---|---|---|---|---|
| Annotation | MMB:DNA local refined map at 7.5 Angstrom resolution | ||||||||||||
| Projections & Slices |
| ||||||||||||
| Density Histograms |
-Additional map: NCP147 local refined map at 6.9 Angstrom resolution
| File | emd_15709_additional_3.map | ||||||||||||
|---|---|---|---|---|---|---|---|---|---|---|---|---|---|
| Annotation | NCP147 local refined map at 6.9 Angstrom resolution | ||||||||||||
| Projections & Slices |
| ||||||||||||
| Density Histograms |


-Additional map: LIN9CTD:NCP local refined map at 7.1 Angstrom resolution
| File | emd_15709_additional_4.map | ||||||||||||
|---|---|---|---|---|---|---|---|---|---|---|---|---|---|
| Annotation | LIN9CTD:NCP local refined map at 7.1 Angstrom resolution | ||||||||||||
| Projections & Slices |
| ||||||||||||
| Density Histograms |


-Additional map: MMBhead local refined map at 7.5 Angstrom resolution
| File | emd_15709_additional_5.map | ||||||||||||
|---|---|---|---|---|---|---|---|---|---|---|---|---|---|
| Annotation | MMBhead local refined map at 7.5 Angstrom resolution | ||||||||||||
| Projections & Slices |
| ||||||||||||
| Density Histograms |


-Additional map: NCP127 local refined map at 3.3 Angstrom resolution
| File | emd_15709_additional_6.map | ||||||||||||
|---|---|---|---|---|---|---|---|---|---|---|---|---|---|
| Annotation | NCP127 local refined map at 3.3 Angstrom resolution | ||||||||||||
| Projections & Slices |
| ||||||||||||
| Density Histograms |
-Additional map: LIN9:52CC local refined map at 8.7 Angstrom resolution
| File | emd_15709_additional_7.map | ||||||||||||
|---|---|---|---|---|---|---|---|---|---|---|---|---|---|
| Annotation | LIN9:52CC local refined map at 8.7 Angstrom resolution | ||||||||||||
| Projections & Slices |
| ||||||||||||
| Density Histograms |

-Half map: MMBcore:NCP overall refined map at 10 Angstrom resolution
| File | emd_15709_half_map_1.map | ||||||||||||
|---|---|---|---|---|---|---|---|---|---|---|---|---|---|
| Annotation | MMBcore:NCP overall refined map at 10 Angstrom resolution | ||||||||||||
| Projections & Slices |
| ||||||||||||
| Density Histograms |


-Half map: MMBcore:NCP overall refined map at 10 Angstrom resolution
| File | emd_15709_half_map_2.map | ||||||||||||
|---|---|---|---|---|---|---|---|---|---|---|---|---|---|
| Annotation | MMBcore:NCP overall refined map at 10 Angstrom resolution | ||||||||||||
| Projections & Slices |
| ||||||||||||
| Density Histograms |

- Sample components
-Entire : MuvBcore:B-MYB complex with a 167bp nucleosome
| Entire | Name: MuvBcore:B-MYB complex with a 167bp nucleosome |
|---|---|
| Components |
|
-Supramolecule #1: MuvBcore:B-MYB complex with a 167bp nucleosome
| Supramolecule | Name: MuvBcore:B-MYB complex with a 167bp nucleosome / type: complex / Chimera: Yes / ID: 1 / Parent: 0 |
|---|---|
| Source (natural) | Organism: Homo sapiens (human) |
| Recombinant expression | Organism:  Trichoplusia ni (cabbage looper) Trichoplusia ni (cabbage looper) |
| Molecular weight | Theoretical: 400 kDa/nm |
-Experimental details
-Structure determination
| Method | cryo EM |
|---|---|
 Processing Processing | single particle reconstruction |
| Aggregation state | particle |
-Sample preparation
| Buffer | pH: 7.5 |
|---|---|
| Vitrification | Cryogen name: ETHANE |
- Electron microscopy
| Microscope | FEI TITAN KRIOS |
|---|---|
| Image recording | Film or detector model: GATAN K3 (6k x 4k) / Average electron dose: 1.5 e/Å2 |
| Electron beam | Acceleration voltage: 300 kV / Electron source:  FIELD EMISSION GUN FIELD EMISSION GUN |
| Electron optics | Illumination mode: FLOOD BEAM / Imaging mode: BRIGHT FIELD / Nominal defocus max: 1.6 µm / Nominal defocus min: 0.6 µm |
| Experimental equipment |  Model: Titan Krios / Image courtesy: FEI Company |
-Image processing
| Final reconstruction | Resolution.type: BY AUTHOR / Resolution: 10.0 Å / Resolution method: FSC 0.143 CUT-OFF / Number images used: 237061 |
|---|---|
| Initial angle assignment | Type: ANGULAR RECONSTITUTION |
| Final angle assignment | Type: ANGULAR RECONSTITUTION |
