Movie
Movie Controller


+ Open data

- Basic information
| Entry |  | |||||||||
|---|---|---|---|---|---|---|---|---|---|---|
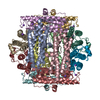
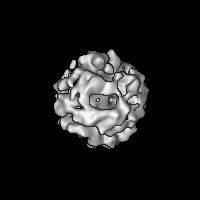
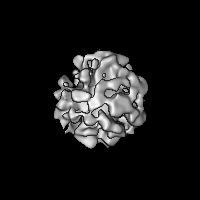
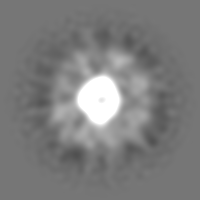
| Title | Dps nanocage with a large mineral core | |||||||||
 Map data Map data | ||||||||||
 Sample Sample |
| |||||||||
| Biological species |  | |||||||||
| Method | single particle reconstruction / cryo EM / Resolution: 14.5 Å | |||||||||
 Authors Authors | Chesnokov YM / Kamyshinsky RA | |||||||||
| Funding support |  Russian Federation, 1 items Russian Federation, 1 items
| |||||||||
 Citation Citation | Journal: Int J Mol Sci / Year: 2022 Title: Structural Insights into Iron Ions Accumulation in Dps Nanocage. Authors: Yury Chesnokov / Andrey Mozhaev / Roman Kamyshinsky / Alexander Gordienko / Liubov Dadinova / Abstract: Dps (DNA-binding protein from starved cells) is well known for the structural protection of bacterial DNA by the formation of highly ordered intracellular assemblies under stress conditions. ...Dps (DNA-binding protein from starved cells) is well known for the structural protection of bacterial DNA by the formation of highly ordered intracellular assemblies under stress conditions. Moreover, this ferritin-like protein can perform fast oxidation of ferrous ions and subsequently accumulate clusters of ferric ions in its nanocages, thus providing the bacterium with physical and chemical protection. Here, cryo-electron microscopy was used to study the accumulation of iron ions in the nanocage of a Dps protein from . We demonstrate that Fe concentration in the solution and incubation time have an insignificant effect on the volume and the morphology of iron minerals formed in Dps nanocages. However, an increase in the Fe level leads to an increase in the proportion of larger clusters and the clusters themselves are composed of discrete ~1-1.5 nm subunits. | |||||||||
| History |
|
- Structure visualization
| Supplemental images |
|---|

- Downloads & links
-EMDB archive
| Map data | emd_14951.map.gz | 28.5 MB |  EMDB map data format EMDB map data format | |
|---|---|---|---|---|
| Header (meta data) | emd-14951-v30.xmlemd-14951.xml | 17.1 KB 17.1 KB | Display Display | EMDB header |
| FSC (resolution estimation) | emd_14951_fsc.xml | 9.3 KB | Display | FSC data file |
| Images |  emd_14951.png emd_14951.png | 91.9 KB | ||
| Masks | emd_14951_msk_1.map | 30.5 MB | Mask map | |
| Others | emd_14951_half_map_1.map.gzemd_14951_half_map_2.map.gz | 28.3 MB 28.3 MB | ||
| Archive directory |  http://ftp.pdbj.org/pub/emdb/structures/EMD-14951ftp://ftp.pdbj.org/pub/emdb/structures/EMD-14951 http://ftp.pdbj.org/pub/emdb/structures/EMD-14951ftp://ftp.pdbj.org/pub/emdb/structures/EMD-14951 | HTTPS FTP |
-Related structure data


-Links
| EMDB pages | EMDB (EBI/PDBe) / EMDataResource |
|---|
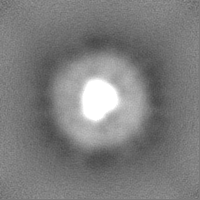
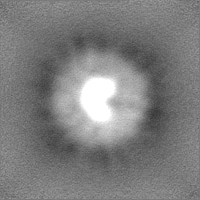
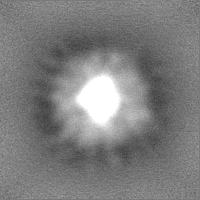
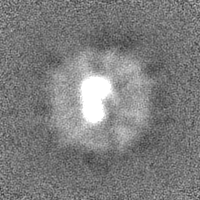
-Map
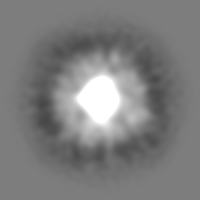
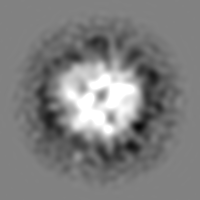
| File | Download / File: emd_14951.map.gz / Format: CCP4 / Size: 30.5 MB / Type: IMAGE STORED AS FLOATING POINT NUMBER (4 BYTES) | ||||||||||||||||||||||||||||||||||||
|---|---|---|---|---|---|---|---|---|---|---|---|---|---|---|---|---|---|---|---|---|---|---|---|---|---|---|---|---|---|---|---|---|---|---|---|---|---|
| Projections & slices | Image control
Images are generated by Spider. | ||||||||||||||||||||||||||||||||||||
| Voxel size | X=Y=Z: 0.86 Å | ||||||||||||||||||||||||||||||||||||
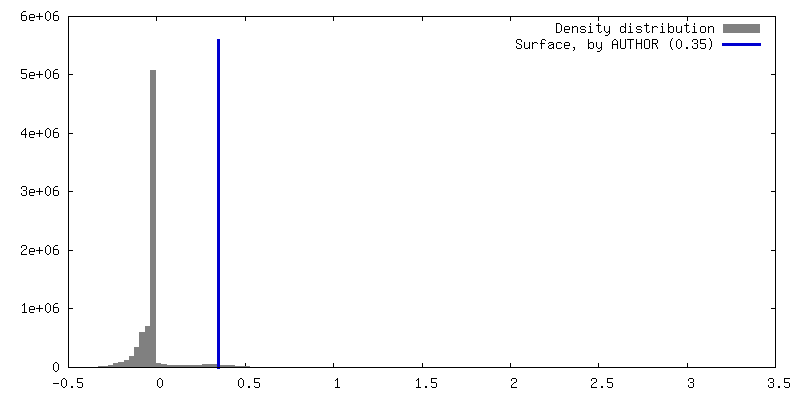
| Density |
| ||||||||||||||||||||||||||||||||||||
| Symmetry | Space group: 1 | ||||||||||||||||||||||||||||||||||||
| Details | EMDB XML:
|
 Z (Sec.)
 Y (Row.)
 X (Col.)


-Supplemental data
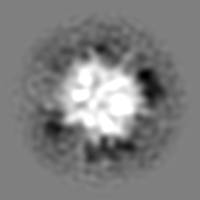
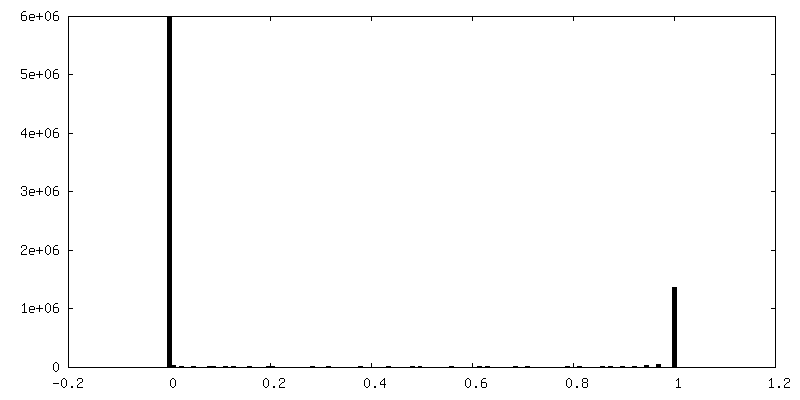
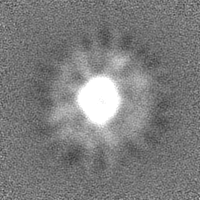
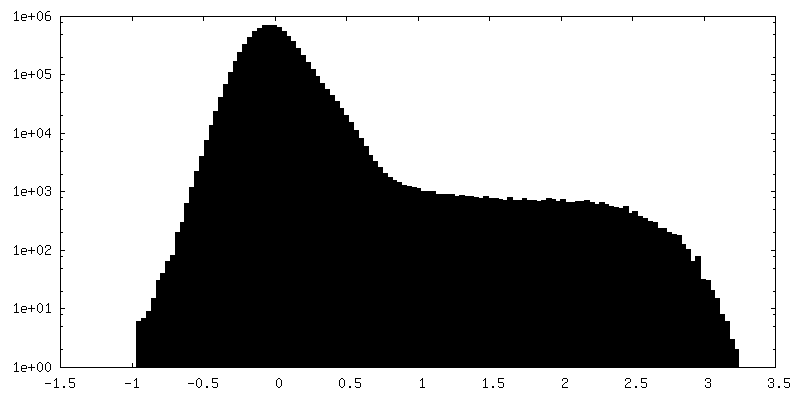
-Mask #1
| File | emd_14951_msk_1.map | ||||||||||||
|---|---|---|---|---|---|---|---|---|---|---|---|---|---|
| Projections & Slices |
| ||||||||||||
| Density Histograms |


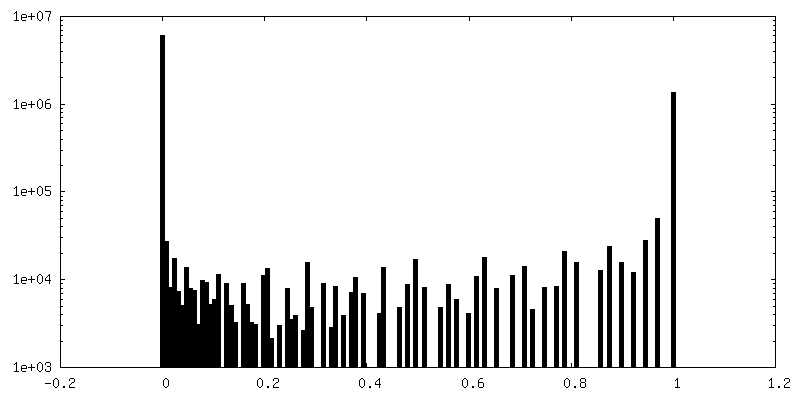
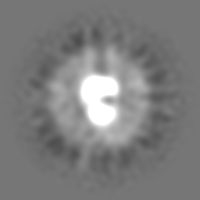
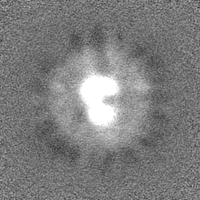
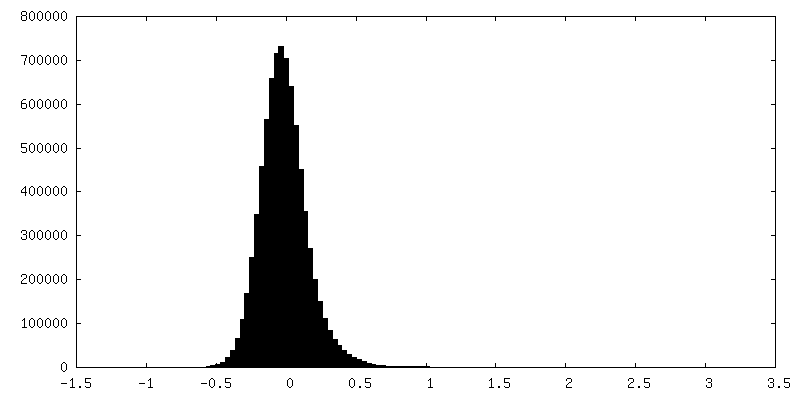
-Half map: #1
| File | emd_14951_half_map_1.map | ||||||||||||
|---|---|---|---|---|---|---|---|---|---|---|---|---|---|
| Projections & Slices |
| ||||||||||||
| Density Histograms |


-Half map: #2
| File | emd_14951_half_map_2.map | ||||||||||||
|---|---|---|---|---|---|---|---|---|---|---|---|---|---|
| Projections & Slices |
| ||||||||||||
| Density Histograms |


- Sample components
-Entire : Dps control
| Entire | Name: Dps control |
|---|---|
| Components |
|
-Supramolecule #1: Dps control
| Supramolecule | Name: Dps control / type: organelle_or_cellular_component / ID: 1 / Parent: 0 |
|---|---|
| Source (natural) | Organism: |
| Molecular weight | Theoretical: 224 KDa |
| Recombinant expression | Organism: |
-Experimental details
-Structure determination
| Method | cryo EM |
|---|---|
 Processing Processing | single particle reconstruction |
| Aggregation state | particle |
-Sample preparation
| Concentration | 3.5 mg/mL | |||||||||||||||
|---|---|---|---|---|---|---|---|---|---|---|---|---|---|---|---|---|
| Buffer | pH: 8 Component:
| |||||||||||||||
| Vitrification | Cryogen name: ETHANE / Chamber humidity: 100 % / Chamber temperature: 293 K / Instrument: FEI VITROBOT MARK IV / Details: blotting for 2.5 seconds. |
- Electron microscopy
| Microscope | FEI TITAN KRIOS |
|---|---|
| Temperature | Min: 78.0 K / Max: 90.0 K |
| Specialist optics | Spherical aberration corrector: Cs corrector by CEOS |
| Image recording | Film or detector model: FEI FALCON II (4k x 4k) / Detector mode: INTEGRATING / Digitization - Dimensions - Width: 4096 pixel / Digitization - Dimensions - Height: 4096 pixel / Digitization - Sampling interval: 14.0 µm / Digitization - Frames/image: 1-40 / Number grids imaged: 1 / Number real images: 1419 / Average exposure time: 2.0 sec. / Average electron dose: 80.0 e/Å2 |
| Electron beam | Acceleration voltage: 300 kV / Electron source:  FIELD EMISSION GUN FIELD EMISSION GUN |
| Electron optics | C2 aperture diameter: 100.0 µm / Calibrated defocus max: 2.0 µm / Calibrated defocus min: 0.8 µm / Calibrated magnification: 162790 / Illumination mode: FLOOD BEAM / Imaging mode: BRIGHT FIELD / Cs: 0.001 mm / Nominal defocus max: 2.0 µm / Nominal defocus min: 0.8 µm / Nominal magnification: 75000 |
| Sample stage | Specimen holder model: FEI TITAN KRIOS AUTOGRID HOLDER / Cooling holder cryogen: NITROGEN |
| Experimental equipment |  Model: Titan Krios / Image courtesy: FEI Company |
+Image processing

-Atomic model buiding 1
| Initial model | PDB ID: |
|---|---|
| Refinement | Space: REAL / Protocol: RIGID BODY FIT |