National Institutes of Health/National Institute of General Medical Sciences (NIH/NIGMS)
GM111730
United States
National Institutes of Health/National Institute of General Medical Sciences (NIH/NIGMS)
GM130995
United States
National Science Foundation (NSF, United States)
United States
Italian Association for Cancer Research
Italy
Citation
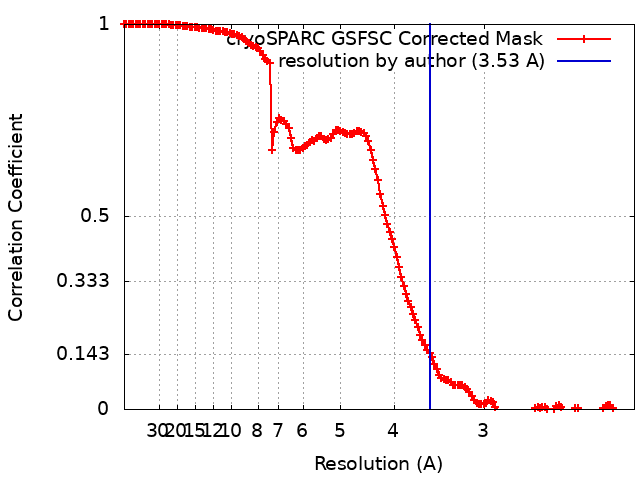
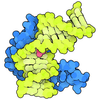
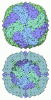
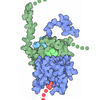
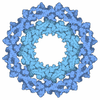
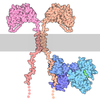
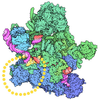
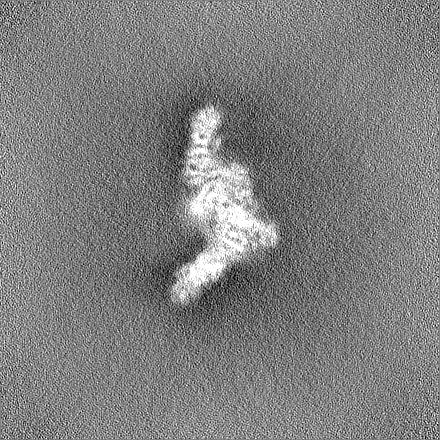
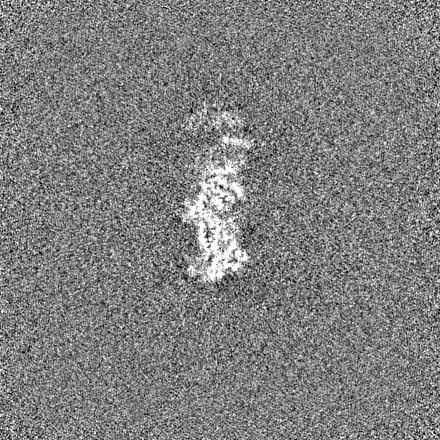
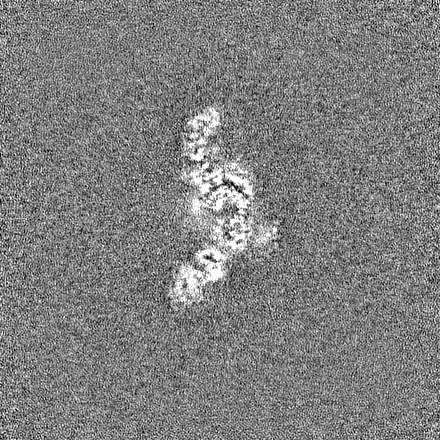
Journal: Sci Adv / Year: 2022 Title: Structural basis for FLCN RagC GAP activation in MiT-TFE substrate-selective mTORC1 regulation. Authors: Rachel M Jansen / Roberta Peruzzo / Simon A Fromm / Adam L Yokom / Roberto Zoncu / James H Hurley / Abstract: The mechanistic target of rapamycin complex 1 (mTORC1) regulates cell growth and catabolism in response to nutrients through phosphorylation of key substrates. The tumor suppressor folliculin (FLCN) ...The mechanistic target of rapamycin complex 1 (mTORC1) regulates cell growth and catabolism in response to nutrients through phosphorylation of key substrates. The tumor suppressor folliculin (FLCN) is a RagC/D guanosine triphosphatase (GTPase)-activating protein (GAP) that regulates mTORC1 phosphorylation of MiT-TFE transcription factors, controlling lysosome biogenesis and autophagy. We determined the cryo-electron microscopy structure of the active FLCN complex (AFC) containing FLCN, FNIP2, the N-terminal tail of SLC38A9, the RagA:RagC GTPase dimer, and the Ragulator scaffold. Relative to the inactive lysosomal FLCN complex structure, FLCN reorients by 90°, breaks contact with RagA, and makes previously unseen contacts with RagC that position its Arg finger for catalysis. Disruption of the AFC-specific interfaces of FLCN and FNIP2 with RagC eliminated GAP activity and led to nuclear retention of TFE3, with no effect on mTORC1 substrates S6K or 4E-BP1. The structure provides a basis for regulation of an mTORC1 substrate-specific pathway and a roadmap to discover MiT-TFE family selective mTORC1 antagonists.
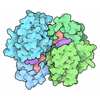
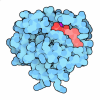
Macromolecule #1: Ras-related GTP-binding protein C
Macromolecule
Name: Ras-related GTP-binding protein C / type: protein_or_peptide / ID: 1 / Number of copies: 1 / Enantiomer: LEVO EC number: Hydrolases; Acting on acid anhydrides; Acting on GTP to facilitate cellular and subcellular movement
In the structure databanks used in Yorodumi, some data are registered as the other names, "COVID-19 virus" and "2019-nCoV". Here are the details of the virus and the list of structure data.
Jan 31, 2019. EMDB accession codes are about to change! (news from PDBe EMDB page)
EMDB accession codes are about to change! (news from PDBe EMDB page)
The allocation of 4 digits for EMDB accession codes will soon come to an end. Whilst these codes will remain in use, new EMDB accession codes will include an additional digit and will expand incrementally as the available range of codes is exhausted. The current 4-digit format prefixed with “EMD-” (i.e. EMD-XXXX) will advance to a 5-digit format (i.e. EMD-XXXXX), and so on. It is currently estimated that the 4-digit codes will be depleted around Spring 2019, at which point the 5-digit format will come into force.
The EM Navigator/Yorodumi systems omit the EMD- prefix.
Related info.:Q: What is EMD? / ID/Accession-code notation in Yorodumi/EM Navigator
Yorodumi is a browser for structure data from EMDB, PDB, SASBDB, etc.
This page is also the successor to EM Navigator detail page, and also detail information page/front-end page for Omokage search.
The word "yorodu" (or yorozu) is an old Japanese word meaning "ten thousand". "mi" (miru) is to see.
Related info.:EMDB / PDB / SASBDB / Comparison of 3 databanks / Yorodumi Search / Aug 31, 2016. New EM Navigator & Yorodumi / Yorodumi Papers / Jmol/JSmol / Function and homology information / Changes in new EM Navigator and Yorodumi
 Movie
Movie Controller


 Open data
 Basic information
 Map data
 Sample
 Keywords
 Function and homology information
 Homo sapiens (human)
 Authors
 United States,
  Italy, 4 items
  Citation
 Structure visualization
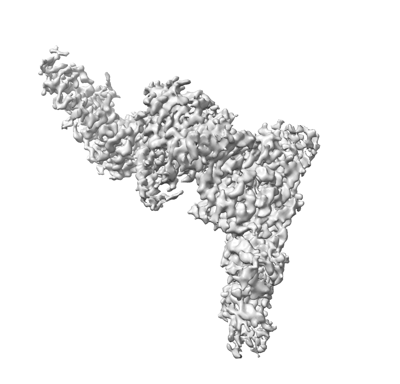
 Downloads & links
 emd_27435.png
 http://ftp.pdbj.org/pub/emdb/structures/EMD-27435
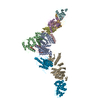
 Z (Sec.)
 Y (Row.)
 X (Col.)


 Sample components
 Spodoptera frugiperda (fall armyworm)
 Processing
 Electron microscopy
 FIELD EMISSION GUN