 Movie
Movie Controller


+ Open data

- Basic information
| Entry | Database: EMDB / ID: EMD-3418 | |||||||||
|---|---|---|---|---|---|---|---|---|---|---|
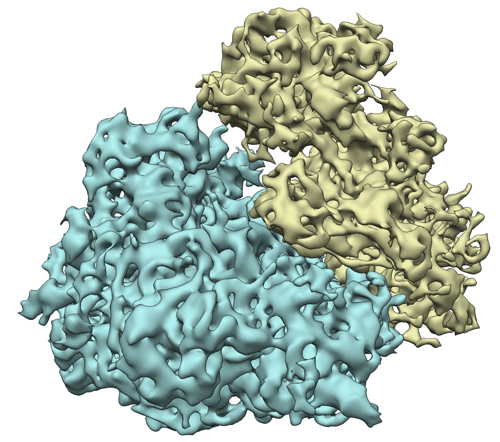
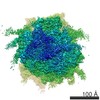
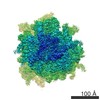
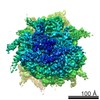
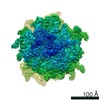
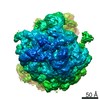
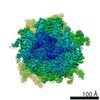
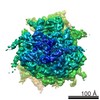
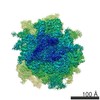
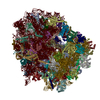
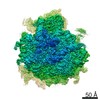
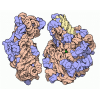
| Title | Subtomogram average of 80S ribosomes obtained using the VPP | |||||||||
 Map data Map data | Subtomogram average of the 80S ribosome obtained with the VPP | |||||||||
 Sample Sample |
| |||||||||
 Keywords Keywords | Ribosome / cryo-electron tomography / subtomogram averaging / phase plate | |||||||||
| Biological species |  | |||||||||
| Method | subtomogram averaging / cryo EM / Resolution: 9.6 Å | |||||||||
 Authors Authors | Khoshouei M / Pfeffer S / Baumeister W / Foerster F / Danev R | |||||||||
 Citation Citation | Journal: J Struct Biol / Year: 2017 Title: Subtomogram analysis using the Volta phase plate. Authors: Maryam Khoshouei / Stefan Pfeffer / Wolfgang Baumeister / Friedrich Förster / Radostin Danev /   Abstract: Cryo-electron tomography (CET) and subtomogram analysis allow studying the structures of macromolecular complexes in their natural context. The radiation sensitivity of vitrified biological specimens ...Cryo-electron tomography (CET) and subtomogram analysis allow studying the structures of macromolecular complexes in their natural context. The radiation sensitivity of vitrified biological specimens and the resulting low signal-to-noise ratio (SNR) in CET limit the amount of structural information that can be mined from tomographic data. The Volta phase plate (VPP) has emerged as an effective means to increase the SNR and hence contrast compared to 'conventional' defocus-based phase contrast transmission electron microscopy (CTEM). Here, we assess the performance of the VPP compared to CTEM in subtomogram analysis, using the mammalian 80S ribosome as a test case. Accurate focusing is the major factor for achieving high resolution with the VPP, as highlighted by a comparison of slightly different focusing strategies. From only 1400 subtomograms, the VPP yields a subtomogram average of the mammalian 80S ribosome at 9.6Å resolution without laborious contrast transfer function (CTF) correction. The subtomogram averages obtained using CTEM approaches are comparable, but suffer from lower signal transfer in certain frequency bands due to the oscillations of the CTF. Our study demonstrates that the VPP is a valuable tool for subtomogram analysis, because it enables improved performance and efficiency in terms of structure localization and number of subtomograms required for a given resolution. | |||||||||
| History |
|
- Structure visualization
| Movie |
 Movie viewer Movie viewer |
|---|---|
| Structure viewer | EM map: SurfViewMolmilJmol/JSmol |
| Supplemental images |
- Downloads & links
-EMDB archive
| Map data | emd_3418.map.gz | 1.6 MB | EMDB map data format | |
|---|---|---|---|---|
| Header (meta data) | emd-3418-v30.xmlemd-3418.xml | 8.2 KB 8.2 KB | Display Display | EMDB header |
| Images | 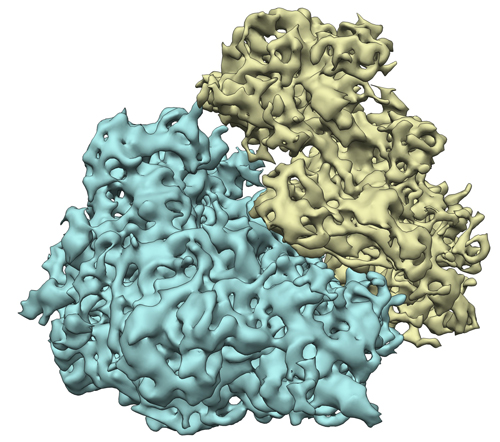 emd_3418.jpg emd_3418.jpg | 194.9 KB | ||
| Archive directory |  http://ftp.pdbj.org/pub/emdb/structures/EMD-3418ftp://ftp.pdbj.org/pub/emdb/structures/EMD-3418 http://ftp.pdbj.org/pub/emdb/structures/EMD-3418ftp://ftp.pdbj.org/pub/emdb/structures/EMD-3418 | HTTPS FTP |
-Related structure data
| Related structure data |  3419C  3420C C: citing same article ( |
|---|---|
| Similar structure data | |
| EM raw data | EMPIAR-10064 (Title: VPP subtomogram averaging / Data size: 33.9 / Data #1: VPP_Ribosome, CTEM_Ribosome [class averages]) |
-Links
| EMDB pages | EMDB (EBI/PDBe) / EMDataResource |
|---|---|
| Related items in Molecule of the Month |
-Map
| File | Download / File: emd_3418.map.gz / Format: CCP4 / Size: 15.3 MB / Type: IMAGE STORED AS FLOATING POINT NUMBER (4 BYTES) | ||||||||||||||||||||||||||||||||||||||||||||||||||||||||||||
|---|---|---|---|---|---|---|---|---|---|---|---|---|---|---|---|---|---|---|---|---|---|---|---|---|---|---|---|---|---|---|---|---|---|---|---|---|---|---|---|---|---|---|---|---|---|---|---|---|---|---|---|---|---|---|---|---|---|---|---|---|---|
| Annotation | Subtomogram average of the 80S ribosome obtained with the VPP | ||||||||||||||||||||||||||||||||||||||||||||||||||||||||||||
| Projections & slices | Image control
Images are generated by Spider. | ||||||||||||||||||||||||||||||||||||||||||||||||||||||||||||
| Voxel size | X=Y=Z: 2.62 Å | ||||||||||||||||||||||||||||||||||||||||||||||||||||||||||||
| Density |
| ||||||||||||||||||||||||||||||||||||||||||||||||||||||||||||
| Symmetry | Space group: 1 | ||||||||||||||||||||||||||||||||||||||||||||||||||||||||||||
| Details | EMDB XML:
CCP4 map header:
| ||||||||||||||||||||||||||||||||||||||||||||||||||||||||||||
 Z (Sec.)
 Y (Row.)
 X (Col.)


-Supplemental data
- Sample components
-Entire : 80S ribosome
| Entire | Name: 80S ribosome |
|---|---|
| Components |
|
-Supramolecule #1000: 80S ribosome
| Supramolecule | Name: 80S ribosome / type: sample / ID: 1000 / Number unique components: 1 |
|---|
-Supramolecule #1: 80S ribosome
| Supramolecule | Name: 80S ribosome / type: complex / ID: 1 / Recombinant expression: No / Ribosome-details: ribosome-eukaryote: ALL |
|---|---|
| Source (natural) | Organism: |
-Experimental details
-Structure determination
| Method | cryo EM |
|---|---|
 Processing Processing | subtomogram averaging |
| Aggregation state | particle |
-Sample preparation
| Buffer | pH: 7.6 / Details: 20mM Hepes, 50mM KCl; 2mM MgCl2 |
|---|---|
| Grid | Details: Quantifoil R 2/1 |
| Vitrification | Cryogen name: ETHANE-PROPANE MIXTURE / Instrument: FEI VITROBOT MARK IV Method: Blotting time of 3 seconds and a blot force of 0 before plunging |
- Electron microscopy
| Microscope | FEI TITAN |
|---|---|
| Specialist optics | Energy filter - Name: GIF Quantum / Energy filter - Lower energy threshold: 0.0 eV / Energy filter - Upper energy threshold: 20.0 eV |
| Date | May 6, 2015 |
| Image recording | Category: CCD / Film or detector model: GATAN K2 SUMMIT (4k x 4k) / Number real images: 80 / Average electron dose: 30 e/Å2 |
| Electron beam | Acceleration voltage: 300 kV / Electron source:  FIELD EMISSION GUN FIELD EMISSION GUN |
| Electron optics | Illumination mode: FLOOD BEAM / Imaging mode: BRIGHT FIELD / Nominal defocus max: 0.0 µm / Nominal defocus min: 0.0 µm |
| Sample stage | Specimen holder model: FEI TITAN KRIOS AUTOGRID HOLDER / Tilt series - Axis1 - Min angle: -20 ° / Tilt series - Axis1 - Max angle: 20 ° |
-Image processing
| Final reconstruction | Applied symmetry - Point group: C1 (asymmetric) / Resolution.type: BY AUTHOR / Resolution: 9.6 Å / Resolution method: OTHER / Software - Name: TOM, AV3, PyTom / Number subtomograms used: 1400 |
|---|---|
| CTF correction | Details: each tilt image |
