 Movie
Movie Controller

[English] 日本語
 Yorodumi
- EMDB-8992: Cryo-electron tomogram of mouse rod connecting cilium and mother ... -
+ Open data

- Basic information
| Entry | Database: EMDB / ID: EMD-8992 | ||||||||||||||||||
|---|---|---|---|---|---|---|---|---|---|---|---|---|---|---|---|---|---|---|---|
| Title | Cryo-electron tomogram of mouse rod connecting cilium and mother centriole with C9 sub-tomogram averaging | ||||||||||||||||||
 Map data Map data | Map derived from C9 sub-tomogram averaging of B04.mrc. Used to generate Fig. 1a(1,3) and 1b-1h. | ||||||||||||||||||
 Sample Sample |
| ||||||||||||||||||
| Biological species |  | ||||||||||||||||||
| Method | electron tomography / cryo EM | ||||||||||||||||||
 Authors Authors | Zhang Z / Liu J / Schmid MF / Wensel TG | ||||||||||||||||||
| Funding support |  United States, 5 items United States, 5 items
| ||||||||||||||||||
 Citation Citation | Journal: Proc Natl Acad Sci U S A / Year: 2019 Title: Defining the layers of a sensory cilium with STORM and cryoelectron nanoscopy. Authors: Michael A Robichaux / Valencia L Potter / Zhixian Zhang / Feng He / Jun Liu / Michael F Schmid / Theodore G Wensel / Abstract: Primary cilia carry out numerous signaling and sensory functions, and defects in them, "ciliopathies," cause a range of symptoms, including blindness. Understanding of their nanometer-scale ciliary ...Primary cilia carry out numerous signaling and sensory functions, and defects in them, "ciliopathies," cause a range of symptoms, including blindness. Understanding of their nanometer-scale ciliary substructures and their disruptions in ciliopathies has been hindered by limitations of conventional microscopic techniques. We have combined cryoelectron tomography, enhanced by subtomogram averaging, with superresolution stochastic optical reconstruction microscopy (STORM) to define subdomains within the light-sensing rod sensory cilium of mouse retinas and reveal previously unknown substructures formed by resident proteins. Domains are demarcated by structural features such as the axoneme and its connections to the ciliary membrane, and are correlated with molecular markers of subcompartments, including the lumen and walls of the axoneme, the membrane glycocalyx, and the intervening cytoplasm. Within this framework, we report spatial distributions of key proteins in wild-type (WT) mice and the effects on them of genetic deficiencies in 3 models of Bardet-Biedl syndrome. | ||||||||||||||||||
| History |
|
- Structure visualization
| Movie |
 Movie viewer Movie viewer |
|---|---|
| Structure viewer | EM map: SurfViewMolmilJmol/JSmol |
| Supplemental images |

- Downloads & links
-EMDB archive
| Map data | emd_8992.map.gz | 1.5 GB | EMDB map data format | |
|---|---|---|---|---|
| Header (meta data) | emd-8992-v30.xmlemd-8992.xml | 17.3 KB 17.3 KB | Display Display | EMDB header |
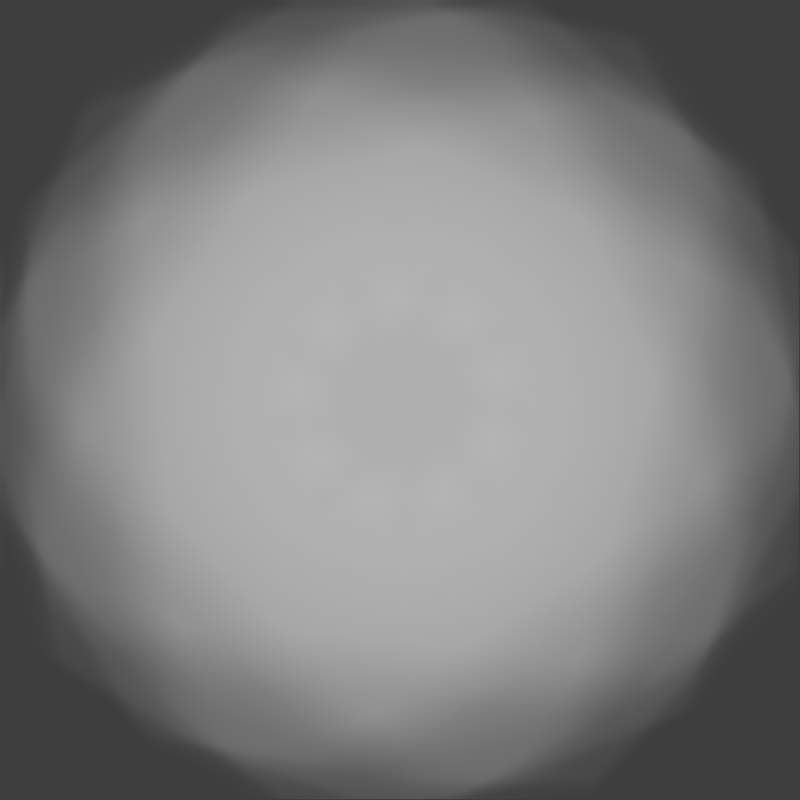
| Images |  emd_8992.png emd_8992.png | 83.6 KB | ||
| Others | emd_8992_additional_1.map.gzemd_8992_additional_2.map.gzemd_8992_additional_3.map.gz | 116.3 MB 1.3 GB 881.6 MB | ||
| Archive directory |  http://ftp.pdbj.org/pub/emdb/structures/EMD-8992ftp://ftp.pdbj.org/pub/emdb/structures/EMD-8992 http://ftp.pdbj.org/pub/emdb/structures/EMD-8992ftp://ftp.pdbj.org/pub/emdb/structures/EMD-8992 | HTTPS FTP |
-Links
| EMDB pages | EMDB (EBI/PDBe) / EMDataResource |
|---|
-Map
| File | Download / File: emd_8992.map.gz / Format: CCP4 / Size: 1.9 GB / Type: IMAGE STORED AS FLOATING POINT NUMBER (4 BYTES) | ||||||||||||||||||||||||||||||||||||||||||||||||||||||||||||||||||||
|---|---|---|---|---|---|---|---|---|---|---|---|---|---|---|---|---|---|---|---|---|---|---|---|---|---|---|---|---|---|---|---|---|---|---|---|---|---|---|---|---|---|---|---|---|---|---|---|---|---|---|---|---|---|---|---|---|---|---|---|---|---|---|---|---|---|---|---|---|---|
| Annotation | Map derived from C9 sub-tomogram averaging of B04.mrc. Used to generate Fig. 1a(1,3) and 1b-1h. | ||||||||||||||||||||||||||||||||||||||||||||||||||||||||||||||||||||
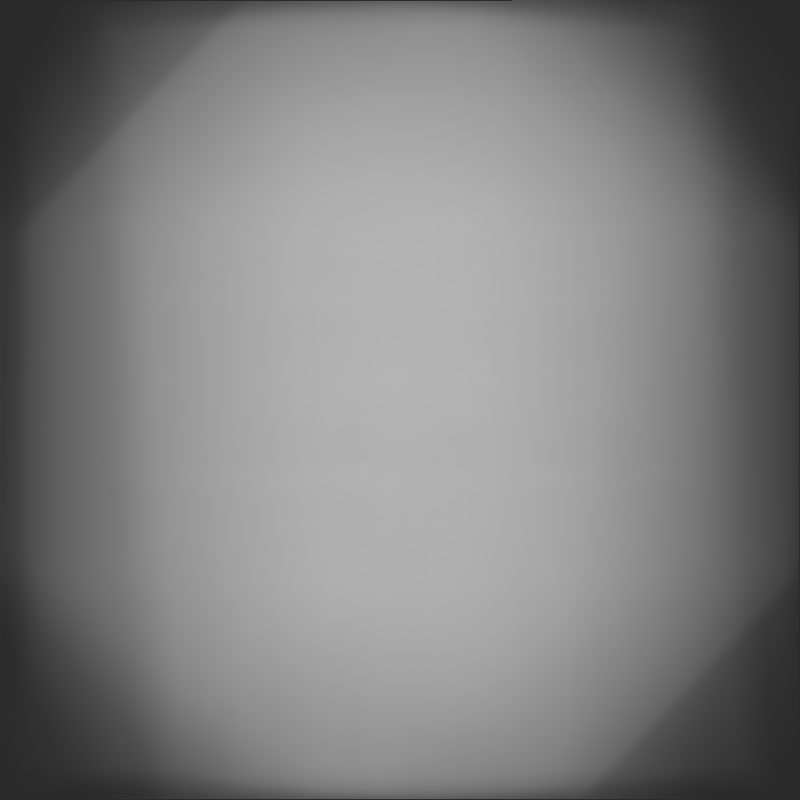
| Projections & slices | Image control
Images are generated by Spider. | ||||||||||||||||||||||||||||||||||||||||||||||||||||||||||||||||||||
| Voxel size | X=Y=Z: 8.9 Å | ||||||||||||||||||||||||||||||||||||||||||||||||||||||||||||||||||||
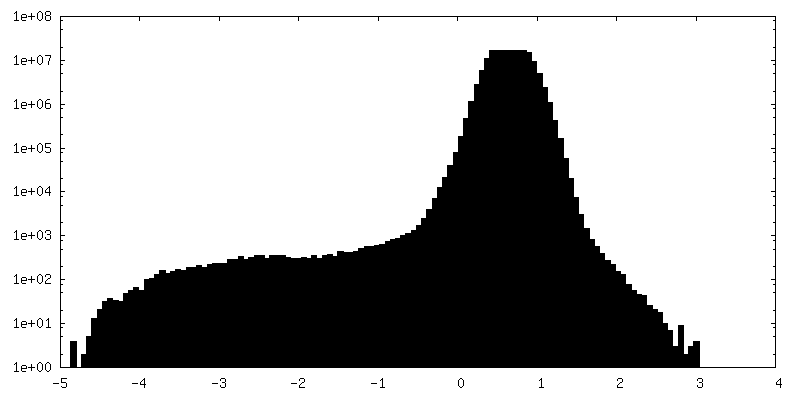
| Density |
| ||||||||||||||||||||||||||||||||||||||||||||||||||||||||||||||||||||
| Symmetry | Space group: 1 | ||||||||||||||||||||||||||||||||||||||||||||||||||||||||||||||||||||
| Details | EMDB XML:
CCP4 map header:
| ||||||||||||||||||||||||||||||||||||||||||||||||||||||||||||||||||||
 Z (Sec.)
 Y (Row.)
 X (Col.)


-Supplemental data
-Additional map: Map constructed from IMOD. Used to generate Fig.1i (1).
| File | emd_8992_additional_1.map | ||||||||||||
|---|---|---|---|---|---|---|---|---|---|---|---|---|---|
| Annotation | Map constructed from IMOD. Used to generate Fig.1i (1). | ||||||||||||
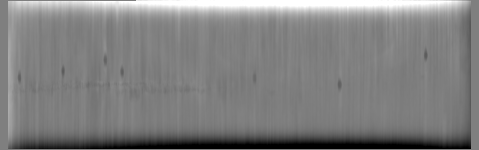
| Projections & Slices |
| ||||||||||||
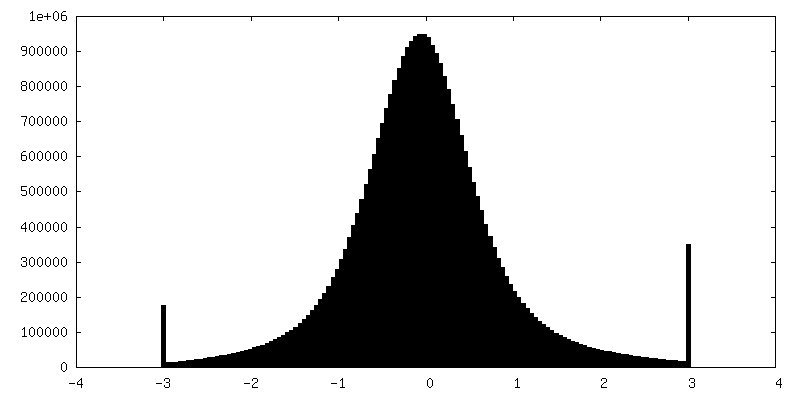
| Density Histograms |


-Additional map: Map constructed from IMOD. Used to generate Fig. 1a(1,3).
| File | emd_8992_additional_2.map | ||||||||||||
|---|---|---|---|---|---|---|---|---|---|---|---|---|---|
| Annotation | Map constructed from IMOD. Used to generate Fig. 1a(1,3). | ||||||||||||
| Projections & Slices |
| ||||||||||||
| Density Histograms |


-Additional map: Map constructed from IMOD. Used to generate Fig. 1i(3,4).
| File | emd_8992_additional_3.map | ||||||||||||
|---|---|---|---|---|---|---|---|---|---|---|---|---|---|
| Annotation | Map constructed from IMOD. Used to generate Fig. 1i(3,4). | ||||||||||||
| Projections & Slices |
| ||||||||||||
| Density Histograms |


- Sample components
-Entire : Base of connecting cilium and mother centriole of mouse rod cell.
| Entire | Name: Base of connecting cilium and mother centriole of mouse rod cell. |
|---|---|
| Components |
|
-Supramolecule #1: Base of connecting cilium and mother centriole of mouse rod cell.
| Supramolecule | Name: Base of connecting cilium and mother centriole of mouse rod cell. type: organelle_or_cellular_component / ID: 1 / Parent: 0 / Macromolecule list: #1 Details: Mouse rod cell fragments were isolated by density gradient centrifugation and applied to EM grid for plunge freezing. |
|---|---|
| Source (natural) | Organism: |
-Experimental details
-Structure determination
| Method | cryo EM |
|---|---|
 Processing Processing | electron tomography |
| Aggregation state | cell |
-Sample preparation
| Buffer | pH: 7.4 / Details: Ringer's buffer |
|---|---|
| Grid | Model: Quantifoil R2/2 / Material: COPPER / Mesh: 200 / Support film - Material: CARBON / Support film - topology: HOLEY / Pretreatment - Type: GLOW DISCHARGE |
| Vitrification | Cryogen name: ETHANE / Instrument: FEI VITROBOT MARK III |
| Details | Isolate rod cell fragments applied to grid. |
| Cryo protectant | None- aqueous buffer |
| Sectioning | Other: NO SECTIONING |
| Fiducial marker | Manufacturer: Electron Microscopy Sciences / Diameter: 15 nm |
- Electron microscopy
| Microscope | FEI POLARA 300 |
|---|---|
| Image recording | Film or detector model: GATAN K2 SUMMIT (4k x 4k) / Digitization - Frames/image: 1-8 / Average electron dose: 1.4 e/Å2 |
| Electron beam | Acceleration voltage: 300 kV / Electron source:  FIELD EMISSION GUN FIELD EMISSION GUN |
| Electron optics | Illumination mode: FLOOD BEAM / Imaging mode: BRIGHT FIELD / Nominal defocus min: 0.009 µm / Nominal magnification: 9400 |
| Sample stage | Cooling holder cryogen: NITROGEN |
| Experimental equipment | 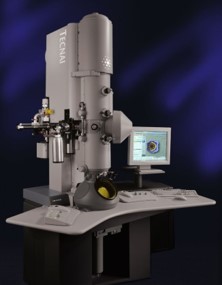 Model: Tecnai Polara / Image courtesy: FEI Company |
-Image processing
| Final reconstruction | Software: (Name: IMOD, EMAN2, UCSF Chimera) / Number images used: 35 |
|---|
