 Movie
Movie Controller


+ Open data

- Basic information
| Entry |  | |||||||||
|---|---|---|---|---|---|---|---|---|---|---|
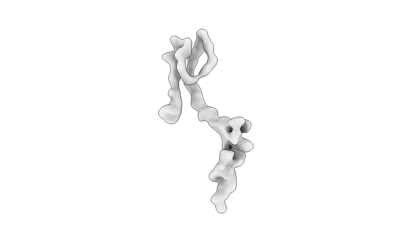
| Title | whole Tom20 | |||||||||
 Map data Map data | ||||||||||
 Sample Sample |
| |||||||||
 Keywords Keywords | mitochondria / transport / membrane protein complex / PROTEIN TRANSPORT | |||||||||
| Biological species |  Homo sapiens (human) Homo sapiens (human) | |||||||||
| Method | single particle reconstruction / cryo EM / Resolution: 4.72 Å | |||||||||
 Authors Authors | Tian XY / Su JY / Sui SF | |||||||||
| Funding support |  China, 1 items China, 1 items
| |||||||||
 Citation Citation | Journal: PNAS Nexus / Year: 2024 Title: Structure of the intact Tom20 receptor in the human translocase of the outer membrane complex. Authors: Jiayue Su / Xuyang Tian / Ziyi Wang / Jiawen Yang / Shan Sun / Sen-Fang Sui / Abstract: The translocase of the outer membrane (TOM) complex serves as the main gate for preproteins entering mitochondria and thus plays a pivotal role in sustaining mitochondrial stability. Precursor ...The translocase of the outer membrane (TOM) complex serves as the main gate for preproteins entering mitochondria and thus plays a pivotal role in sustaining mitochondrial stability. Precursor proteins, featuring amino-terminal targeting signals (presequences) or internal targeting signals, are recognized by the TOM complex receptors Tom20, Tom22, and Tom70, and then translocated into mitochondria through Tom40. By using chemical cross-linking to stabilize Tom20 in the TOM complex, this study unveils the structure of the human TOM holo complex, encompassing the intact Tom20 component, at a resolution of approximately 6 Å by cryo-electron microscopy. Our structure shows the TOM holo complex containing only one Tom20 subunit, which is located right at the center of the complex and stabilized by extensive interactions with Tom22, Tom40, and Tom6. Based on the structure, we proposed a possible translocation mode of TOM complex, by which different receptors could work simultaneously to ensure that the preproteins recognized by them are all efficiently translocated into the mitochondria. | |||||||||
| History |
|
- Structure visualization
| Supplemental images |
|---|
- Downloads & links
-EMDB archive
| Map data | emd_60278.map.gz | 41.9 MB |  EMDB map data format EMDB map data format | |
|---|---|---|---|---|
| Header (meta data) | emd-60278-v30.xmlemd-60278.xml | 13.7 KB 13.7 KB | Display Display | EMDB header |
| Images |  emd_60278.png emd_60278.png | 12.2 KB | ||
| Filedesc metadata | emd-60278.cif.gz | 4 KB | ||
| Others | emd_60278_half_map_1.map.gzemd_60278_half_map_2.map.gz | 77.8 MB 77.8 MB | ||
| Archive directory |  http://ftp.pdbj.org/pub/emdb/structures/EMD-60278ftp://ftp.pdbj.org/pub/emdb/structures/EMD-60278 http://ftp.pdbj.org/pub/emdb/structures/EMD-60278ftp://ftp.pdbj.org/pub/emdb/structures/EMD-60278 | HTTPS FTP |
-Related structure data

-Links
| EMDB pages | EMDB (EBI/PDBe) / EMDataResource |
|---|
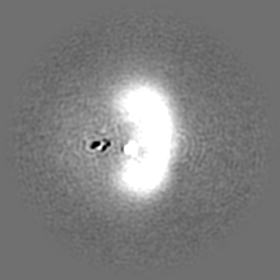
-Map
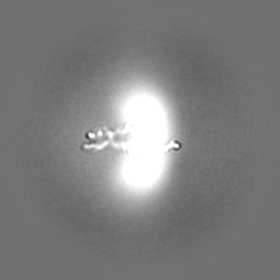
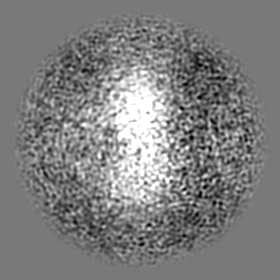
| File | Download / File: emd_60278.map.gz / Format: CCP4 / Size: 83.7 MB / Type: IMAGE STORED AS FLOATING POINT NUMBER (4 BYTES) | ||||||||||||||||||||||||||||||||||||
|---|---|---|---|---|---|---|---|---|---|---|---|---|---|---|---|---|---|---|---|---|---|---|---|---|---|---|---|---|---|---|---|---|---|---|---|---|---|
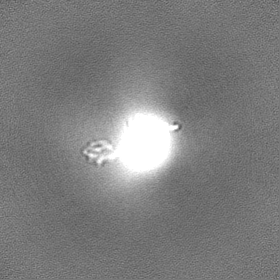
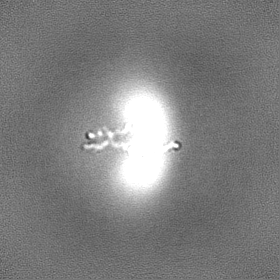
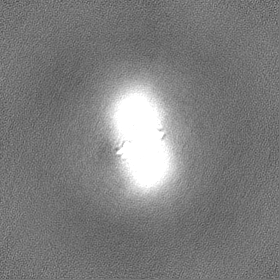
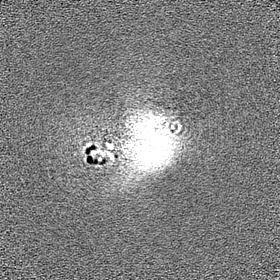
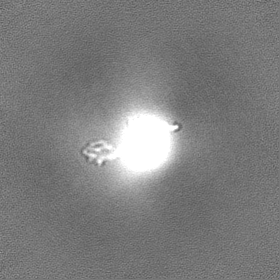
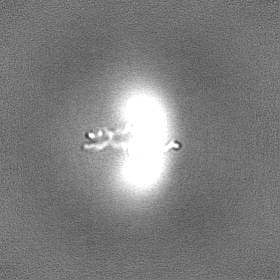
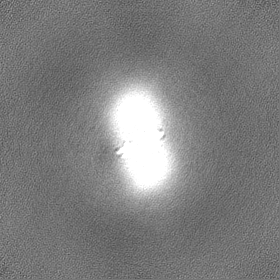
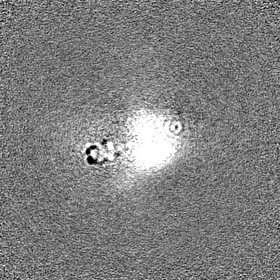
| Projections & slices | Image control
Images are generated by Spider. | ||||||||||||||||||||||||||||||||||||
| Voxel size | X=Y=Z: 1.0825 Å | ||||||||||||||||||||||||||||||||||||
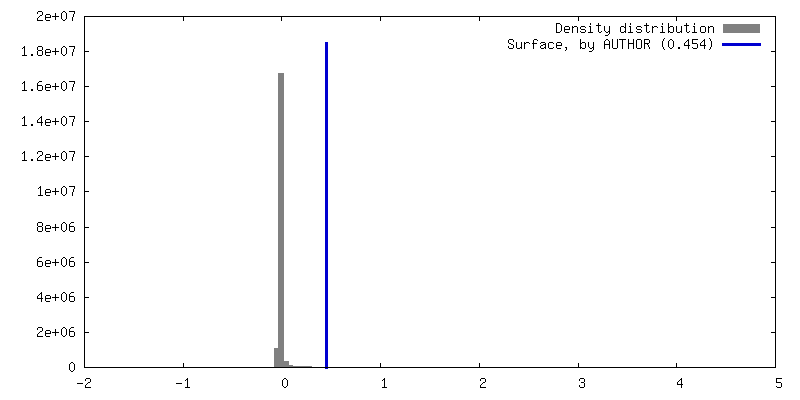
| Density |
| ||||||||||||||||||||||||||||||||||||
| Symmetry | Space group: 1 | ||||||||||||||||||||||||||||||||||||
| Details | EMDB XML:
|
 Z (Sec.)
 Y (Row.)
 X (Col.)


-Supplemental data
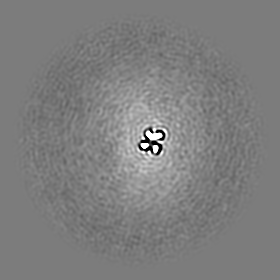
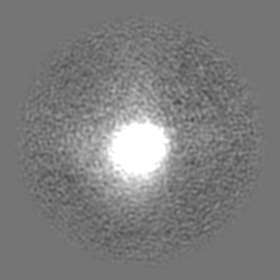
-Half map: #1
| File | emd_60278_half_map_1.map | ||||||||||||
|---|---|---|---|---|---|---|---|---|---|---|---|---|---|
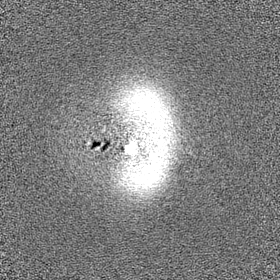
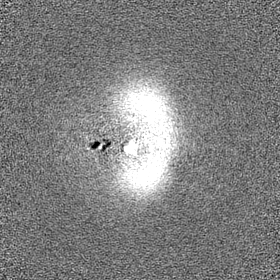
| Projections & Slices |
| ||||||||||||
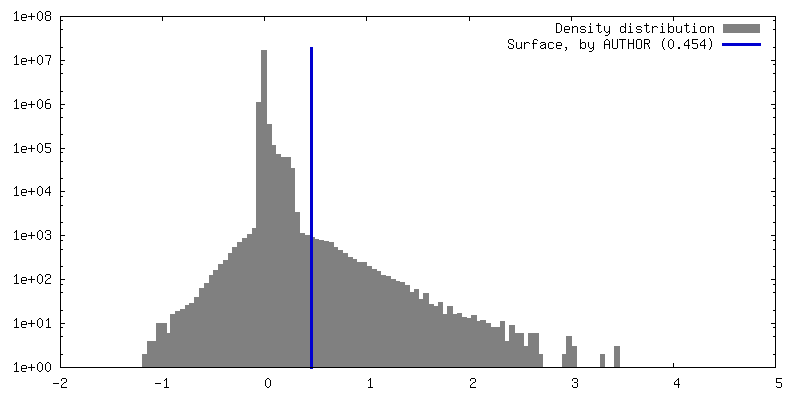
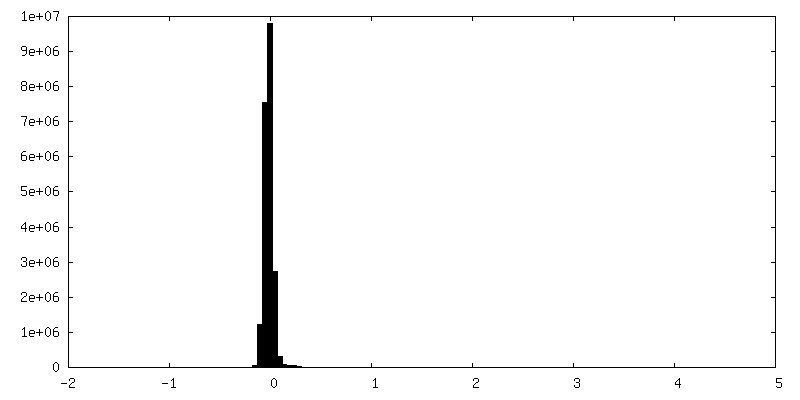
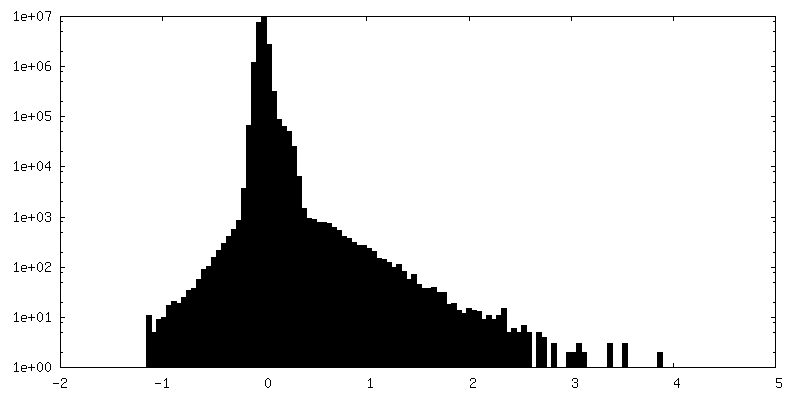
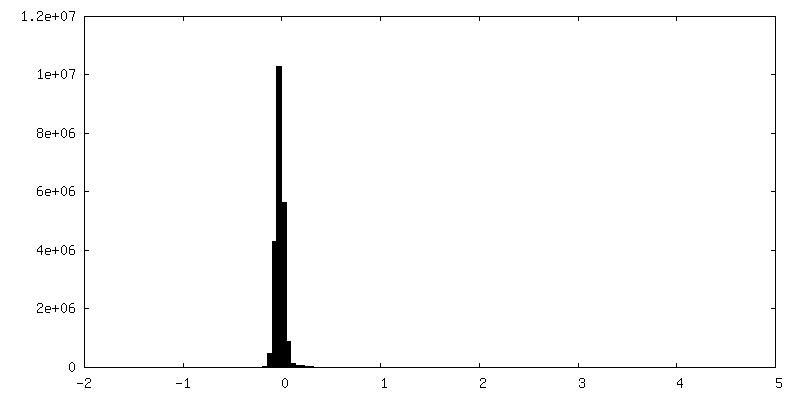
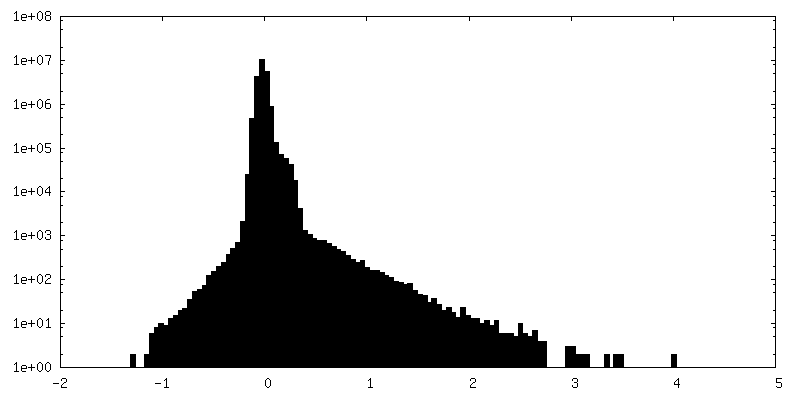
| Density Histograms |
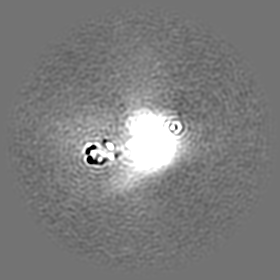
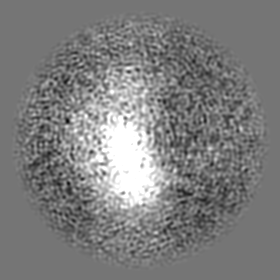
-Half map: #2
| File | emd_60278_half_map_2.map | ||||||||||||
|---|---|---|---|---|---|---|---|---|---|---|---|---|---|
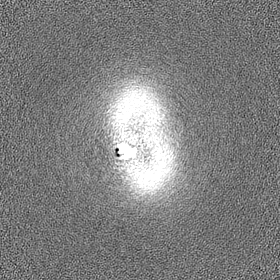
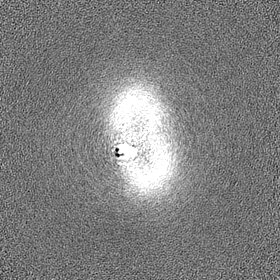
| Projections & Slices |
| ||||||||||||
| Density Histograms |
- Sample components
-Entire : TOM complex with whole Tom20
| Entire | Name: TOM complex with whole Tom20 |
|---|---|
| Components |
|
-Supramolecule #1: TOM complex with whole Tom20
| Supramolecule | Name: TOM complex with whole Tom20 / type: complex / ID: 1 / Parent: 0 / Macromolecule list: #1-#6 |
|---|---|
| Source (natural) | Organism: Homo sapiens (human) |
| Molecular weight | Theoretical: 168.3 kDa/nm |
-Experimental details
-Structure determination
| Method | cryo EM |
|---|---|
 Processing Processing | single particle reconstruction |
| Aggregation state | particle |
-Sample preparation
| Buffer | pH: 7.4 Component:
| ||||||||||||
|---|---|---|---|---|---|---|---|---|---|---|---|---|---|
| Vitrification | Cryogen name: ETHANE / Chamber humidity: 100 % / Chamber temperature: 282 K |
- Electron microscopy
| Microscope | FEI TITAN KRIOS |
|---|---|
| Image recording | Film or detector model: GATAN K3 (6k x 4k) / Average electron dose: 50.0 e/Å2 |
| Electron beam | Acceleration voltage: 300 kV / Electron source:  FIELD EMISSION GUN FIELD EMISSION GUN |
| Electron optics | Illumination mode: FLOOD BEAM / Imaging mode: BRIGHT FIELD / Nominal defocus max: 1.8 µm / Nominal defocus min: 1.3 µm |
| Experimental equipment |  Model: Titan Krios / Image courtesy: FEI Company |
+Image processing

-Atomic model buiding 1
| Refinement | Protocol: RIGID BODY FIT |
|---|
