 Movie
Movie Controller


+ Open data

- Basic information
| Entry |  | |||||||||
|---|---|---|---|---|---|---|---|---|---|---|
| Title | KtrA.ADP with cyclic di-AMP prepared on the vitrobot | |||||||||
 Map data Map data | This is the sharpened map from the refined 35 383 particle stack. | |||||||||
 Sample Sample |
| |||||||||
 Keywords Keywords | sample preparation / air-water interface / potassium transport / RCK C domain / TRANSPORT PROTEIN | |||||||||
| Biological species |  | |||||||||
| Method | single particle reconstruction / cryo EM / Resolution: 4.2 Å | |||||||||
 Authors Authors | Hirst IJ / Muench SP / Darrow MC / Scarff CA / Thompson RF | |||||||||
| Funding support |  United Kingdom, 1 items United Kingdom, 1 items
| |||||||||
 Citation Citation | Journal: J Struct Biol / Year: 2025 Title: Untangling the effects of flexibility and the AWI in cryoEM sample preparation: A case study using KtrA. Authors: Isobel Jackson Hirst / Wesley Tien Chiang / Nien-Jen Hu / Charlotte A Scarff / Rebecca F Thompson / Michele C Darrow / Stephen P Muench /  Abstract: Single particle cryo-electron microscopy (cryoEM) is a powerful tool for elucidating the structures of biological macromolecules without requiring crystallisation or fixation. However, certain ...Single particle cryo-electron microscopy (cryoEM) is a powerful tool for elucidating the structures of biological macromolecules without requiring crystallisation or fixation. However, certain barriers to obtaining high-resolution structures persist, particularly during grid preparation when samples are in a thin liquid film. At this stage, extensive exposure to the air-water interface (AWI) can lead to subunit dissociation, denaturation, and preferred orientation of particles. Another obstacle to high-resolution cryoEM is molecular flexibility, which introduces heterogeneity in the dataset, weakening the signal during image processing. This study explores the effects of AWI interactions and molecular flexibility on the cryoEM density maps of KtrA, the soluble regulatory subunit of the potassium transporter KtrAB from Bacillus subtilis. From grids prepared using a standard blotting technique, we observed a lack of density in the C-lobe domains and preferred orientation. Modifications such as reducing AWI exposure through faster vitrification times (6 s vs ≤100 ms) notably improved C-lobe density. Moreover, the addition of cyclic di-AMP, which binds to the C-lobes, combined with a 100 ms plunge time, further enhanced C-lobe density and eliminated preferred orientation. These findings demonstrate that both AWI interactions and flexibility had to be addressed to obtain density for the C-lobe domains of KtrA. This study underscores the ongoing complexities in achieving high-resolution cryoEM for many samples. | |||||||||
| History |
|
- Structure visualization
| Supplemental images |
|---|

- Downloads & links
-EMDB archive
| Map data | emd_51924.map.gz | 259.1 MB |  EMDB map data format EMDB map data format | |
|---|---|---|---|---|
| Header (meta data) | emd-51924-v30.xmlemd-51924.xml | 18.1 KB 18.1 KB | Display Display | EMDB header |
| FSC (resolution estimation) | emd_51924_fsc.xml | 13.8 KB | Display | FSC data file |
| Images |  emd_51924.png emd_51924.png | 37.9 KB | ||
| Filedesc metadata | emd-51924.cif.gz | 4.8 KB | ||
| Others | emd_51924_additional_1.map.gzemd_51924_half_map_1.map.gzemd_51924_half_map_2.map.gz | 242.3 MB 255.2 MB 255.2 MB | ||
| Archive directory |  http://ftp.pdbj.org/pub/emdb/structures/EMD-51924ftp://ftp.pdbj.org/pub/emdb/structures/EMD-51924 http://ftp.pdbj.org/pub/emdb/structures/EMD-51924ftp://ftp.pdbj.org/pub/emdb/structures/EMD-51924 | HTTPS FTP |
-Related structure data
| Related structure data | C: citing same article ( |
|---|


-Links
| EMDB pages | EMDB (EBI/PDBe) / EMDataResource |
|---|
-Map
| File | Download / File: emd_51924.map.gz / Format: CCP4 / Size: 274.6 MB / Type: IMAGE STORED AS FLOATING POINT NUMBER (4 BYTES) | ||||||||||||||||||||||||||||||||||||
|---|---|---|---|---|---|---|---|---|---|---|---|---|---|---|---|---|---|---|---|---|---|---|---|---|---|---|---|---|---|---|---|---|---|---|---|---|---|
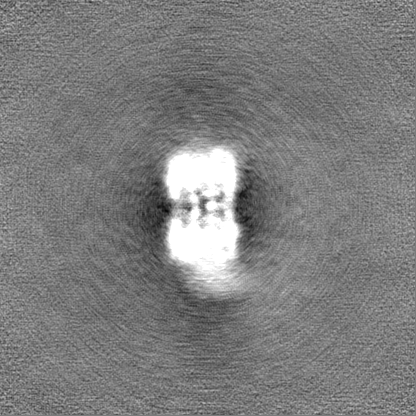
| Annotation | This is the sharpened map from the refined 35 383 particle stack. | ||||||||||||||||||||||||||||||||||||
| Projections & slices | Image control
Images are generated by Spider. | ||||||||||||||||||||||||||||||||||||
| Voxel size | X=Y=Z: 0.83 Å | ||||||||||||||||||||||||||||||||||||
| Density |
| ||||||||||||||||||||||||||||||||||||
| Symmetry | Space group: 1 | ||||||||||||||||||||||||||||||||||||
| Details | EMDB XML:
|
 Z (Sec.)
 Y (Row.)
 X (Col.)


-Supplemental data
-Additional map: This is the map after it has been...
| File | emd_51924_additional_1.map | ||||||||||||
|---|---|---|---|---|---|---|---|---|---|---|---|---|---|
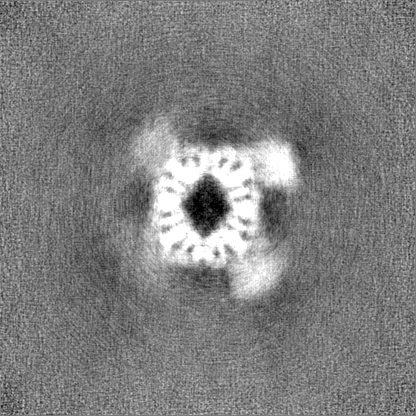
| Annotation | This is the map after it has been low pass filtered in EMAN to 8 A. This map was used for comparison and is the one that is showed in figure 3 in the corresponding paper. | ||||||||||||
| Projections & Slices |
| ||||||||||||
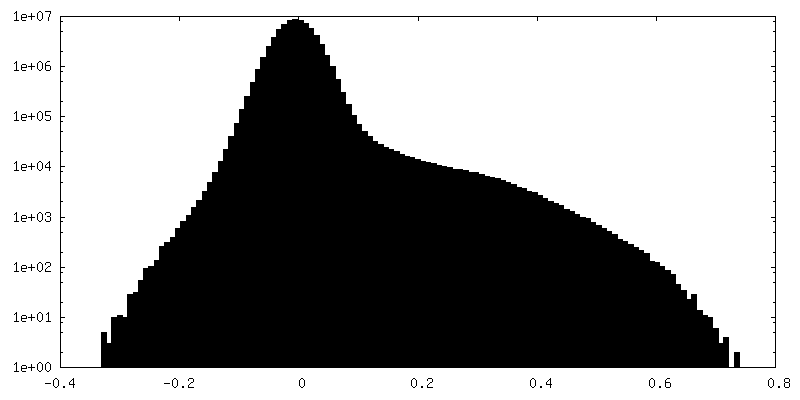
| Density Histograms |


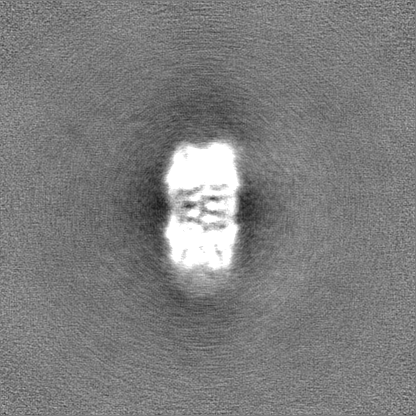
-Half map: #1
| File | emd_51924_half_map_1.map | ||||||||||||
|---|---|---|---|---|---|---|---|---|---|---|---|---|---|
| Projections & Slices |
| ||||||||||||
| Density Histograms |


-Half map: #2
| File | emd_51924_half_map_2.map | ||||||||||||
|---|---|---|---|---|---|---|---|---|---|---|---|---|---|
| Projections & Slices |
| ||||||||||||
| Density Histograms |


- Sample components
-Entire : KtrA, the regulatory subunit from the KtrAB potassium transporter
| Entire | Name: KtrA, the regulatory subunit from the KtrAB potassium transporter |
|---|---|
| Components |
|
-Supramolecule #1: KtrA, the regulatory subunit from the KtrAB potassium transporter
| Supramolecule | Name: KtrA, the regulatory subunit from the KtrAB potassium transporter type: complex / ID: 1 / Parent: 0 Details: This is map is part of an investigation into the effects of sample preparation on map quality. |
|---|---|
| Source (natural) | Organism: |
| Molecular weight | Theoretical: 198 KDa |
-Experimental details
-Structure determination
| Method | cryo EM |
|---|---|
 Processing Processing | single particle reconstruction |
| Aggregation state | particle |
-Sample preparation
| Concentration | 0.5 mg/mL | |||||||||
|---|---|---|---|---|---|---|---|---|---|---|
| Buffer | pH: 8 Component:
Details: 50 mM Tris-HCl, 150 mM KCl, 0.5 mM TCEP with 250 uM CDA | |||||||||
| Grid | Model: Quantifoil R1.2/1.3 / Material: COPPER / Mesh: 300 / Support film - Material: CARBON / Support film - topology: HOLEY | |||||||||
| Vitrification | Cryogen name: ETHANE / Chamber humidity: 100 % / Chamber temperature: 277 K / Instrument: FEI VITROBOT MARK IV |
- Electron microscopy
| Microscope | TFS KRIOS |
|---|---|
| Specialist optics | Energy filter - Name: TFS Selectris |
| Image recording | Film or detector model: FEI FALCON IV (4k x 4k) / Number grids imaged: 1 / Number real images: 6056 / Average exposure time: 3.1 sec. / Average electron dose: 40.5 e/Å2 |
| Electron beam | Acceleration voltage: 300 kV / Electron source:  FIELD EMISSION GUN FIELD EMISSION GUN |
| Electron optics | Illumination mode: FLOOD BEAM / Imaging mode: BRIGHT FIELD / Cs: 2.7 mm / Nominal defocus max: 3.0 µm / Nominal defocus min: 1.5 µm / Nominal magnification: 165000 |
| Sample stage | Specimen holder model: FEI TITAN KRIOS AUTOGRID HOLDER / Cooling holder cryogen: NITROGEN |
| Experimental equipment |  Model: Titan Krios / Image courtesy: FEI Company |

