 Movie
Movie Controller

[English] 日本語
 Yorodumi
- EMDB-50415: Subtomogram average of 80S ribosomes in S. cerevisiae under acute... -
+ Open data

- Basic information
| Entry |  | |||||||||
|---|---|---|---|---|---|---|---|---|---|---|
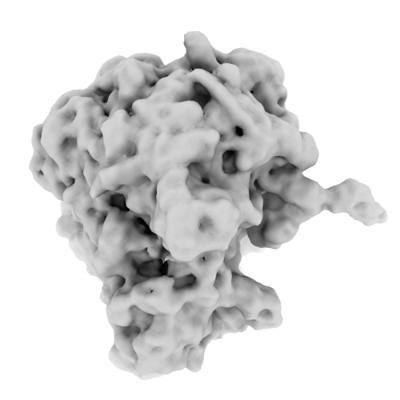
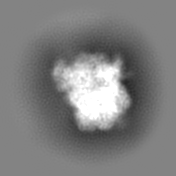
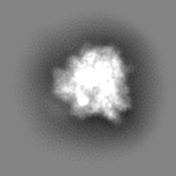
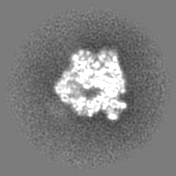
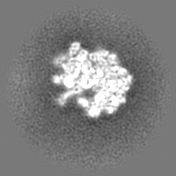
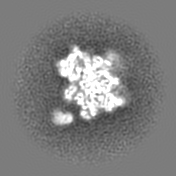
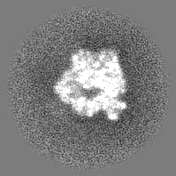
| Title | Subtomogram average of 80S ribosomes in S. cerevisiae under acute glucose starvation | |||||||||
 Map data Map data | Subtomogram average of 80S ribosomes in S. cerevisiae under acute glucose starvation | |||||||||
 Sample Sample |
| |||||||||
 Keywords Keywords | Globular protein / translation / RIBOSOME | |||||||||
| Biological species |  | |||||||||
| Method | subtomogram averaging / cryo EM / Resolution: 10.2 Å | |||||||||
 Authors Authors | Spindler MC / Mahamid J | |||||||||
| Funding support | European Union, 1 items
| |||||||||
 Citation Citation | Journal: Mol Cell / Year: 2024 Title: Polysome collapse and RNA condensation fluidize the cytoplasm. Authors: Ying Xie / Tong Shu / Tiewei Liu / Marie-Christin Spindler / Julia Mahamid / Glen M Hocky / David Gresham / Liam J Holt /   Abstract: The cell interior is packed with macromolecules of mesoscale size, and this crowded milieu significantly influences cellular physiology. Cellular stress responses almost universally lead to ...The cell interior is packed with macromolecules of mesoscale size, and this crowded milieu significantly influences cellular physiology. Cellular stress responses almost universally lead to inhibition of translation, resulting in polysome collapse and release of mRNA. The released mRNA molecules condense with RNA-binding proteins to form ribonucleoprotein (RNP) condensates known as processing bodies and stress granules. Here, we show that polysome collapse and condensation of RNA transiently fluidize the cytoplasm, and coarse-grained molecular dynamic simulations support this as a minimal mechanism for the observed biophysical changes. Increased mesoscale diffusivity correlates with the efficient formation of quality control bodies (Q-bodies), membraneless organelles that compartmentalize misfolded peptides during stress. Synthetic, light-induced RNA condensation also fluidizes the cytoplasm. Together, our study reveals a functional role for stress-induced translation inhibition and formation of RNP condensates in modulating the physical properties of the cytoplasm to enable efficient response of cells to stress conditions. | |||||||||
| History |
|
- Structure visualization
| Supplemental images |
|---|
- Downloads & links
-EMDB archive
| Map data | emd_50415.map.gz | 19.3 MB |  EMDB map data format EMDB map data format | |
|---|---|---|---|---|
| Header (meta data) | emd-50415-v30.xmlemd-50415.xml | 13.3 KB 13.3 KB | Display Display | EMDB header |
| FSC (resolution estimation) | emd_50415_fsc.xml | 6.8 KB | Display | FSC data file |
| Images |  emd_50415.png emd_50415.png | 60.6 KB | ||
| Masks | emd_50415_msk_1.map | 20.8 MB | Mask map | |
| Filedesc metadata | emd-50415.cif.gz | 4.1 KB | ||
| Others | emd_50415_half_map_1.map.gzemd_50415_half_map_2.map.gz | 10.6 MB 10.6 MB | ||
| Archive directory |  http://ftp.pdbj.org/pub/emdb/structures/EMD-50415ftp://ftp.pdbj.org/pub/emdb/structures/EMD-50415 http://ftp.pdbj.org/pub/emdb/structures/EMD-50415ftp://ftp.pdbj.org/pub/emdb/structures/EMD-50415 | HTTPS FTP |
-Related structure data

-Links
| EMDB pages | EMDB (EBI/PDBe) / EMDataResource |
|---|
-Map
| File | Download / File: emd_50415.map.gz / Format: CCP4 / Size: 20.8 MB / Type: IMAGE STORED AS FLOATING POINT NUMBER (4 BYTES) | ||||||||||||||||||||||||||||||||||||
|---|---|---|---|---|---|---|---|---|---|---|---|---|---|---|---|---|---|---|---|---|---|---|---|---|---|---|---|---|---|---|---|---|---|---|---|---|---|
| Annotation | Subtomogram average of 80S ribosomes in S. cerevisiae under acute glucose starvation | ||||||||||||||||||||||||||||||||||||
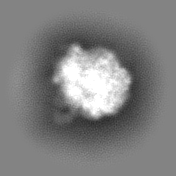
| Projections & slices | Image control
Images are generated by Spider. | ||||||||||||||||||||||||||||||||||||
| Voxel size |
| ||||||||||||||||||||||||||||||||||||
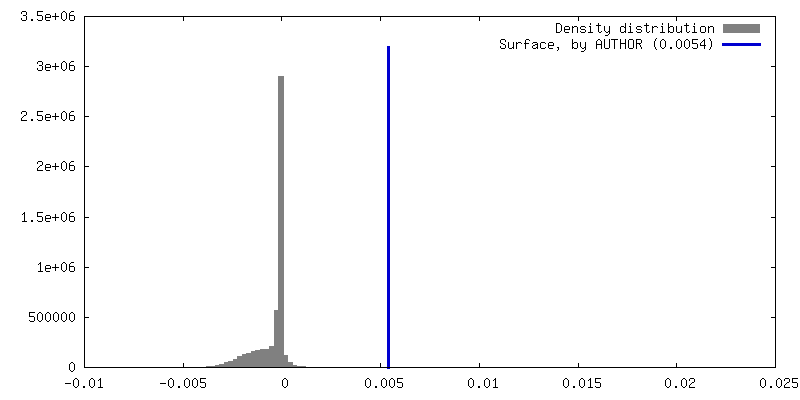
| Density |
| ||||||||||||||||||||||||||||||||||||
| Symmetry | Space group: 1 | ||||||||||||||||||||||||||||||||||||
| Details | EMDB XML:
|
 Z (Sec.)
 Y (Row.)
 X (Col.)


-Supplemental data
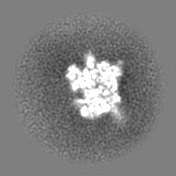
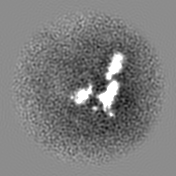
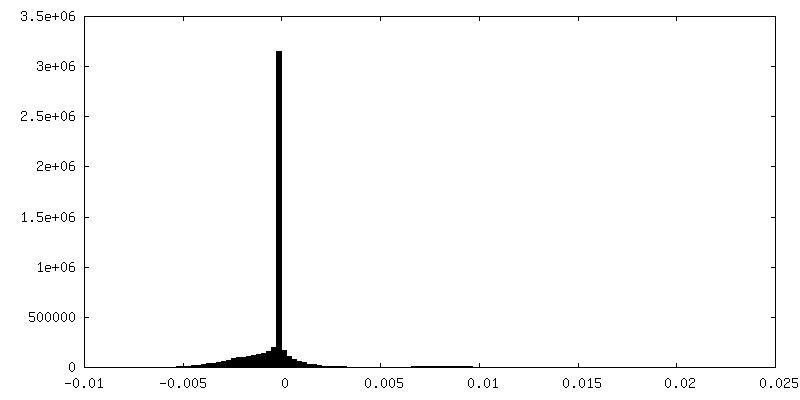
-Mask #1
| File | emd_50415_msk_1.map | ||||||||||||
|---|---|---|---|---|---|---|---|---|---|---|---|---|---|
| Projections & Slices |
| ||||||||||||
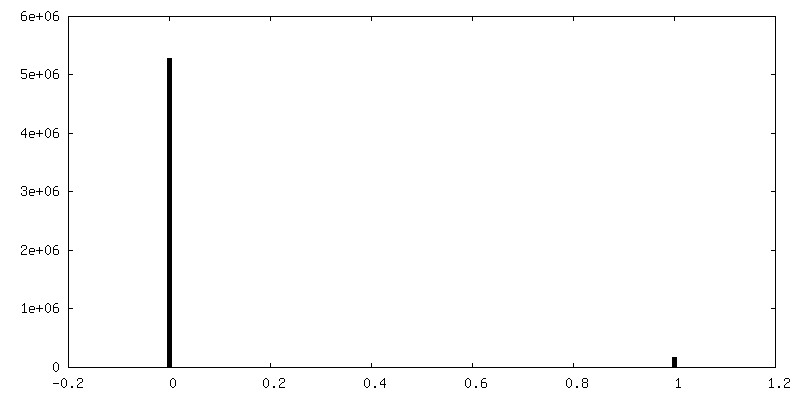
| Density Histograms |


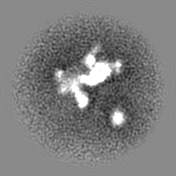
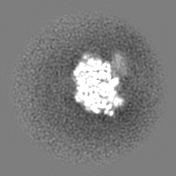
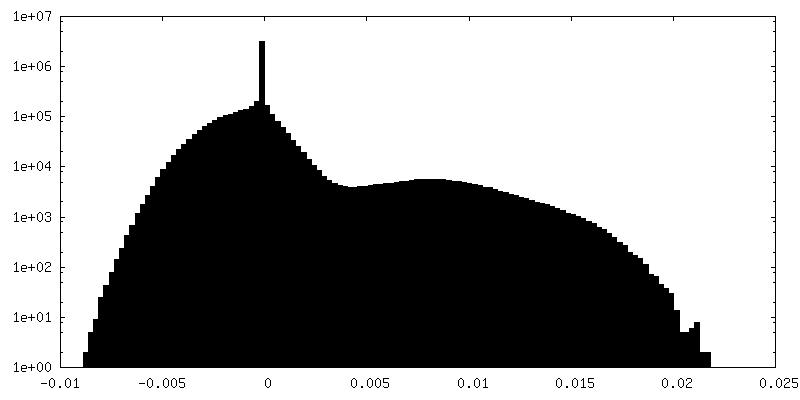
-Half map: First half map of subtomogram average of 80S...
| File | emd_50415_half_map_1.map | ||||||||||||
|---|---|---|---|---|---|---|---|---|---|---|---|---|---|
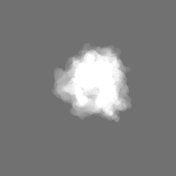
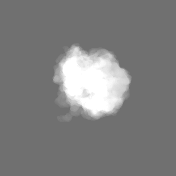
| Annotation | First half map of subtomogram average of 80S ribosomes in S. cerevisiae under acute glucose starvation | ||||||||||||
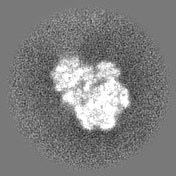
| Projections & Slices |
| ||||||||||||
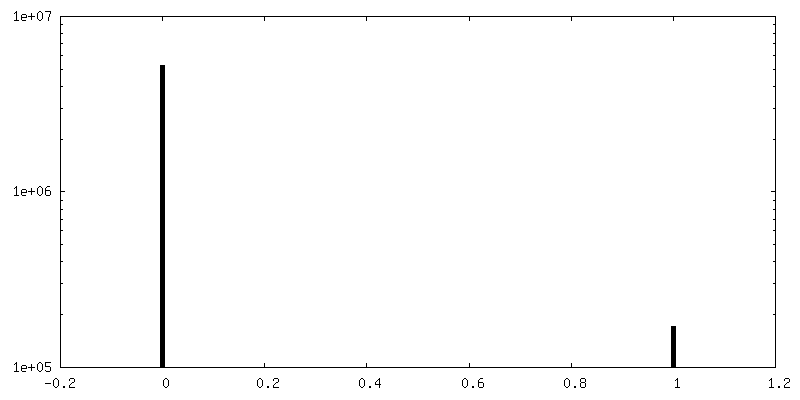
| Density Histograms |


- Sample components
-Entire : Cryo-focused ion beam milled lamellae of S.cerevisiae cells under...
| Entire | Name: Cryo-focused ion beam milled lamellae of S.cerevisiae cells under acute glucose starvation |
|---|---|
| Components |
|
-Supramolecule #1: Cryo-focused ion beam milled lamellae of S.cerevisiae cells under...
| Supramolecule | Name: Cryo-focused ion beam milled lamellae of S.cerevisiae cells under acute glucose starvation type: cell / ID: 1 / Parent: 0 |
|---|---|
| Source (natural) | Organism: |
-Experimental details
-Structure determination
| Method | cryo EM |
|---|---|
 Processing Processing | subtomogram averaging |
| Aggregation state | cell |
-Sample preparation
| Buffer | pH: 6 |
|---|---|
| Vitrification | Cryogen name: ETHANE / Instrument: LEICA EM GP |
- Electron microscopy
| Microscope | FEI TITAN KRIOS |
|---|---|
| Image recording | Film or detector model: GATAN K3 (6k x 4k) / Average electron dose: 2.11792 e/Å2 |
| Electron beam | Acceleration voltage: 300 kV / Electron source:  FIELD EMISSION GUN FIELD EMISSION GUN |
| Electron optics | C2 aperture diameter: 70.0 µm / Illumination mode: FLOOD BEAM / Imaging mode: BRIGHT FIELD / Cs: 2.7 mm / Nominal defocus max: 4.0 µm / Nominal defocus min: 2.0 µm / Nominal magnification: 26000 |
| Sample stage | Specimen holder model: FEI TITAN KRIOS AUTOGRID HOLDER / Cooling holder cryogen: NITROGEN |
| Experimental equipment |  Model: Titan Krios / Image courtesy: FEI Company |
-Image processing
| Final reconstruction | Resolution.type: BY AUTHOR / Resolution: 10.2 Å / Resolution method: FSC 0.143 CUT-OFF / Software - Name: RELION (ver. 4.0.1) / Number subtomograms used: 51821 |
|---|---|
| Extraction | Number tomograms: 10 / Number images used: 53596 / Method: DeePiCt 3D CNN + manual / Software - Name: Warp (ver. 1.0.9) |
| Final angle assignment | Type: MAXIMUM LIKELIHOOD |
| FSC plot (resolution estimation) |  |
