[English] 日本語
 Yorodumi
- EMDB-49404: Subtomogram Averaging of Liganded EGFR Dimer from Extracellular V... -
+ Open data
- Basic information
| Entry |  | |||||||||||||||
|---|---|---|---|---|---|---|---|---|---|---|---|---|---|---|---|---|
| Title | Subtomogram Averaging of Liganded EGFR Dimer from Extracellular Vesicle | |||||||||||||||
 Map data Map data | ||||||||||||||||
 Sample Sample |
| |||||||||||||||
 Keywords Keywords | EGFR / Receptor Tyrosine Kinase / Extracellular Vesicle / MEMBRANE PROTEIN | |||||||||||||||
| Biological species |  Homo sapiens (human) Homo sapiens (human) | |||||||||||||||
| Method | subtomogram averaging / cryo EM / Resolution: 15.0 Å | |||||||||||||||
 Authors Authors | Ke Z / Liu C / Gonzalez-Magaldi M / Leahy DJ | |||||||||||||||
| Funding support |  United States, 4 items United States, 4 items
| |||||||||||||||
 Citation Citation |  Journal: Proc Natl Acad Sci U S A / Year: 2025 Journal: Proc Natl Acad Sci U S A / Year: 2025Title: Structure and organization of full-length epidermal growth factor receptor in extracellular vesicles by cryo-electron tomography. Authors: Monica Gonzalez-Magaldi / Anuradha Gullapalli / Ophelia Papoulas / Chang Liu / Adelaide Y-H Leung / Luqiang Guo / Axel F Brilot / Edward M Marcotte / Zunlong Ke / Daniel J Leahy /  Abstract: We report here transport of full-length epidermal growth factor receptor (EGFR), Insulin Receptor, 7-pass transmembrane receptor Smoothened, and 13-pass Sodium-iodide symporter to extracellular ...We report here transport of full-length epidermal growth factor receptor (EGFR), Insulin Receptor, 7-pass transmembrane receptor Smoothened, and 13-pass Sodium-iodide symporter to extracellular vesicles (EVs) for structural and functional studies. Mass spectrometry confirmed the transported proteins are the most abundant in EV membranes, and the presence of many receptor-interacting proteins in EVs demonstrates their utility for characterizing membrane protein interactomes. Cryo-electron tomography of EGFR-containing EVs reveals that EGFR forms clusters in both the presence and absence of EGF with a ~3 nm gap between the inner membrane and cytoplasmic density. EGFR extracellular region (ECR) dimers do not form regular arrays in these clusters. Subtomogram averaging of the 150 kDa EGF-bound EGFR ECR dimer yielded a 15 Å map into which the crystal structure of the ligand-bound EGFR ECR dimer fits well. These findings refine our understanding of EGFR activation, clustering, and signaling and establish EVs as a versatile platform for structural and functional characterization of human membrane proteins in cell-derived membranes. | |||||||||||||||
| History |
|
- Structure visualization
| Supplemental images |
|---|
- Downloads & links
-EMDB archive
| Map data |  emd_49404.map.gz emd_49404.map.gz | 24.6 MB |  EMDB map data format EMDB map data format | |
|---|---|---|---|---|
| Header (meta data) |  emd-49404-v30.xml emd-49404-v30.xml emd-49404.xml emd-49404.xml | 17.8 KB 17.8 KB | Display Display |  EMDB header EMDB header |
| FSC (resolution estimation) |  emd_49404_fsc.xml emd_49404_fsc.xml | 6.9 KB | Display |  FSC data file FSC data file |
| Images |  emd_49404.png emd_49404.png | 72.2 KB | ||
| Masks |  emd_49404_msk_1.map emd_49404_msk_1.map | 27 MB |  Mask map Mask map | |
| Filedesc metadata |  emd-49404.cif.gz emd-49404.cif.gz | 5.3 KB | ||
| Others |  emd_49404_additional_1.map.gz emd_49404_additional_1.map.gz emd_49404_half_map_1.map.gz emd_49404_half_map_1.map.gz emd_49404_half_map_2.map.gz emd_49404_half_map_2.map.gz | 19.7 MB 19.8 MB 19.8 MB | ||
| Archive directory |  http://ftp.pdbj.org/pub/emdb/structures/EMD-49404 http://ftp.pdbj.org/pub/emdb/structures/EMD-49404 ftp://ftp.pdbj.org/pub/emdb/structures/EMD-49404 ftp://ftp.pdbj.org/pub/emdb/structures/EMD-49404 | HTTPS FTP |
-Validation report
| Summary document |  emd_49404_validation.pdf.gz emd_49404_validation.pdf.gz | 955.2 KB | Display |  EMDB validaton report EMDB validaton report |
|---|---|---|---|---|
| Full document |  emd_49404_full_validation.pdf.gz emd_49404_full_validation.pdf.gz | 954.8 KB | Display | |
| Data in XML |  emd_49404_validation.xml.gz emd_49404_validation.xml.gz | 12.6 KB | Display | |
| Data in CIF |  emd_49404_validation.cif.gz emd_49404_validation.cif.gz | 17.4 KB | Display | |
| Arichive directory |  https://ftp.pdbj.org/pub/emdb/validation_reports/EMD-49404 https://ftp.pdbj.org/pub/emdb/validation_reports/EMD-49404 ftp://ftp.pdbj.org/pub/emdb/validation_reports/EMD-49404 ftp://ftp.pdbj.org/pub/emdb/validation_reports/EMD-49404 | HTTPS FTP |
- Links
Links
| EMDB pages |  EMDB (EBI/PDBe) / EMDB (EBI/PDBe) /  EMDataResource EMDataResource |
|---|
- Map
Map
| File |  Download / File: emd_49404.map.gz / Format: CCP4 / Size: 27 MB / Type: IMAGE STORED AS FLOATING POINT NUMBER (4 BYTES) Download / File: emd_49404.map.gz / Format: CCP4 / Size: 27 MB / Type: IMAGE STORED AS FLOATING POINT NUMBER (4 BYTES) | ||||||||||||||||||||||||||||||||||||
|---|---|---|---|---|---|---|---|---|---|---|---|---|---|---|---|---|---|---|---|---|---|---|---|---|---|---|---|---|---|---|---|---|---|---|---|---|---|
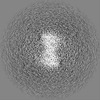
| Projections & slices | Image control
Images are generated by Spider. | ||||||||||||||||||||||||||||||||||||
| Voxel size | X=Y=Z: 1.69 Å | ||||||||||||||||||||||||||||||||||||
| Density |
| ||||||||||||||||||||||||||||||||||||
| Symmetry | Space group: 1 | ||||||||||||||||||||||||||||||||||||
| Details | EMDB XML:
|
-Supplemental data
-Mask #1
| File |  emd_49404_msk_1.map emd_49404_msk_1.map | ||||||||||||
|---|---|---|---|---|---|---|---|---|---|---|---|---|---|
| Projections & Slices |
| ||||||||||||
| Density Histograms |
-Additional map: #1
| File | emd_49404_additional_1.map | ||||||||||||
|---|---|---|---|---|---|---|---|---|---|---|---|---|---|
| Projections & Slices |
| ||||||||||||
| Density Histograms |
-Half map: #1
| File | emd_49404_half_map_1.map | ||||||||||||
|---|---|---|---|---|---|---|---|---|---|---|---|---|---|
| Projections & Slices |
| ||||||||||||
| Density Histograms |
-Half map: #2
| File | emd_49404_half_map_2.map | ||||||||||||
|---|---|---|---|---|---|---|---|---|---|---|---|---|---|
| Projections & Slices |
| ||||||||||||
| Density Histograms |
- Sample components
-Entire : the EGFR extracellular region in extracellular vesicles
| Entire | Name: the EGFR extracellular region in extracellular vesicles |
|---|---|
| Components |
|
-Supramolecule #1: the EGFR extracellular region in extracellular vesicles
| Supramolecule | Name: the EGFR extracellular region in extracellular vesicles type: complex / ID: 1 / Parent: 0 / Macromolecule list: all |
|---|---|
| Source (natural) | Organism:  Homo sapiens (human) Homo sapiens (human) |
-Macromolecule #1: Liganded EGFR dimer extracellular region
| Macromolecule | Name: Liganded EGFR dimer extracellular region / type: other / ID: 1 / Classification: other |
|---|---|
| Source (natural) | Organism:  Homo sapiens (human) Homo sapiens (human) |
| Sequence | String: LEEKKVCQGT SNKLTQLGTF EDHFLSLQRM FNNCEVVLGN LEITYVQRNY DLSFLKTIQE VAGYVLIALN TVERIPLENL QIIRGNMYYE NSYALAVLSN YDANKTGLKE LPMRNLQEIL HGAVRFSNNP ALCNVESIQW RDIVSSDFLS NMSMDFQNHL GSCQKCDPSC ...String: LEEKKVCQGT SNKLTQLGTF EDHFLSLQRM FNNCEVVLGN LEITYVQRNY DLSFLKTIQE VAGYVLIALN TVERIPLENL QIIRGNMYYE NSYALAVLSN YDANKTGLKE LPMRNLQEIL HGAVRFSNNP ALCNVESIQW RDIVSSDFLS NMSMDFQNHL GSCQKCDPSC PNGSCWGAGE ENCQKLTKII CAQQCSGRCR GKSPSDCCHN QCAAGCTGPR ESDCLVCRKF RDEATCKDTC PPLMLYNPTT YQMDVNPEGK YSFGATCVKK CPRNYVVTDH GSCVRACGAD SYEMEEDGVR KCKKCEGPCR KVCNGIGIGE FKDSLSINAT NIKHFKNCTS ISGDLHILPV AFRGDSFTHT PPLDPQELDI LKTVKEITGF LLIQAWPENR TDLHAFENLE IIRGRTKQHG QFSLAVVSLN ITSLGLRSLK EISDGDVIIS GNKNLCYANT INWKKLFGTS GQKTKIISNR GENSCKATGQ VCHALCSPEG CWGPEPRDCV SCRNVSRGRE CVDKCKLLEG EPREFVENSE CIQCHPECLP QAMNITCTGR GPDNCIQCAH YIDGPHCVKT CPAGVMGENN TLVWKYADAG HVCHLCHPNC TYGCTGPGLE GCPT |
| Recombinant expression | Organism:  Homo sapiens (human) Homo sapiens (human) |
-Experimental details
-Structure determination
| Method | cryo EM |
|---|---|
 Processing Processing | subtomogram averaging |
| Aggregation state | particle |
- Sample preparation
| Buffer | pH: 7 |
|---|---|
| Vitrification | Cryogen name: ETHANE |
- Electron microscopy
| Microscope | TFS KRIOS |
|---|---|
| Image recording | Film or detector model: GATAN K3 BIOCONTINUUM (6k x 4k) / Average electron dose: 3.0 e/Å2 |
| Electron beam | Acceleration voltage: 300 kV / Electron source:  FIELD EMISSION GUN FIELD EMISSION GUN |
| Electron optics | Illumination mode: FLOOD BEAM / Imaging mode: BRIGHT FIELD / Cs: 2.7 mm / Nominal defocus max: 5.0 µm / Nominal defocus min: 4.0 µm |
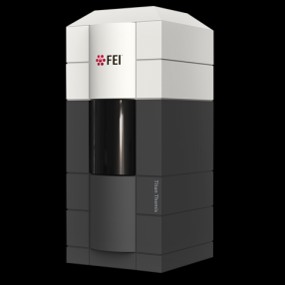
| Experimental equipment |  Model: Titan Krios / Image courtesy: FEI Company |
 Movie
Movie Controller


 Z (Sec.)
 Y (Row.)
 X (Col.)


