National Institutes of Health/National Heart, Lung, and Blood Institute (NIH/NHLBI)
R01HL145473
United States
Citation
Journal: Proc Natl Acad Sci U S A / Year: 2024 Title: Structural insights into the regulation of RyR1 by S100A1. Authors: Gunnar Weninger / Marco C Miotto / Carl Tchagou / Steven Reiken / Haikel Dridi / Sören Brandenburg / Gabriel C Riedemann / Qi Yuan / Yang Liu / Alexander Chang / Anetta Wronska / Stephan E ...Authors: Gunnar Weninger / Marco C Miotto / Carl Tchagou / Steven Reiken / Haikel Dridi / Sören Brandenburg / Gabriel C Riedemann / Qi Yuan / Yang Liu / Alexander Chang / Anetta Wronska / Stephan E Lehnart / Andrew R Marks / Abstract: S100A1, a small homodimeric EF-hand Ca-binding protein (~21 kDa), plays an important regulatory role in Ca signaling pathways involved in various biological functions including Ca cycling and ...S100A1, a small homodimeric EF-hand Ca-binding protein (~21 kDa), plays an important regulatory role in Ca signaling pathways involved in various biological functions including Ca cycling and contractile performance in skeletal and cardiac myocytes. One key target of the S100A1 interactome is the ryanodine receptor (RyR), a huge homotetrameric Ca release channel (~2.3 MDa) of the sarcoplasmic reticulum. Here, we report cryoelectron microscopy structures of S100A1 bound to RyR1, the skeletal muscle isoform, in absence and presence of Ca. Ca-free apo-S100A1 binds beneath the bridging solenoid (BSol) and forms contacts with the junctional solenoid and the shell-core linker of RyR1. Upon Ca-binding, S100A1 undergoes a conformational change resulting in the exposure of the hydrophobic pocket known to serve as a major interaction site of S100A1. Through interactions of the hydrophobic pocket with RyR1, Ca-bound S100A1 intrudes deeper into the RyR1 structure beneath BSol than the apo-form and induces sideways motions of the C-terminal BSol region toward the adjacent RyR1 protomer resulting in tighter interprotomer contacts. Interestingly, the second hydrophobic pocket of the S100A1-dimer is largely exposed at the hydrophilic surface making it prone to interactions with the local environment, suggesting that S100A1 could be involved in forming larger heterocomplexes of RyRs with other protein partners. Since S100A1 interactions stabilizing BSol are implicated in the regulation of RyR-mediated Ca release, the characterization of the S100A1 binding site conserved between RyR isoforms may provide the structural basis for the development of therapeutic strategies regarding treatments of RyR-related disorders.
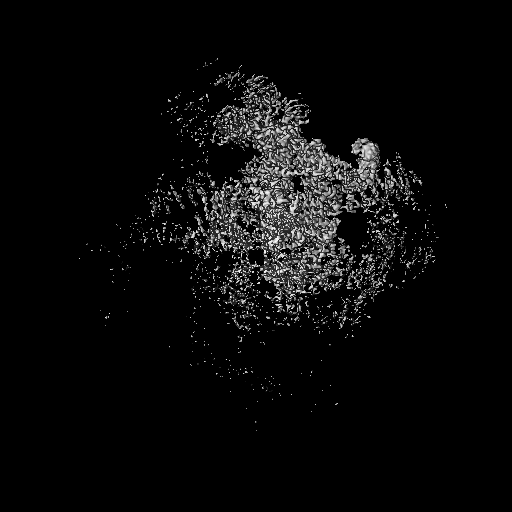
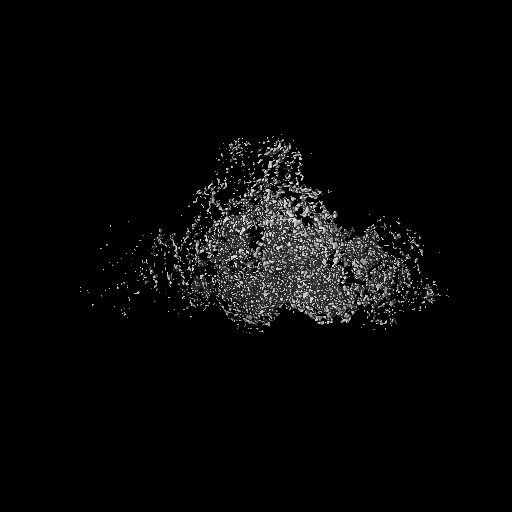
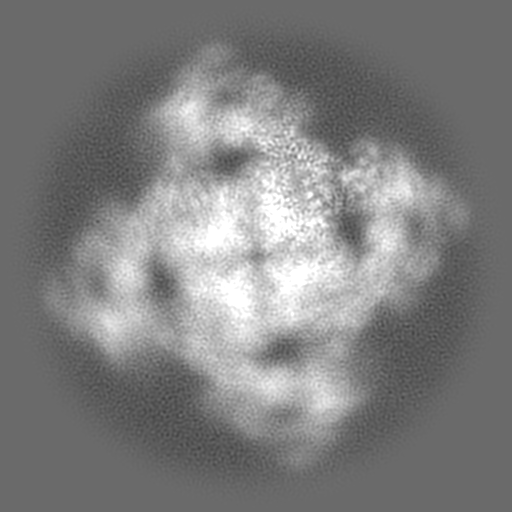
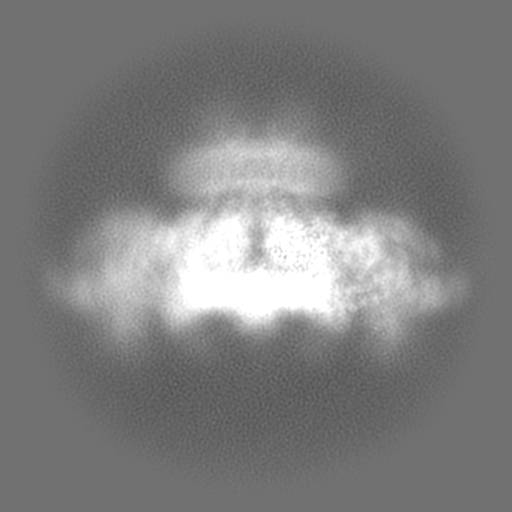
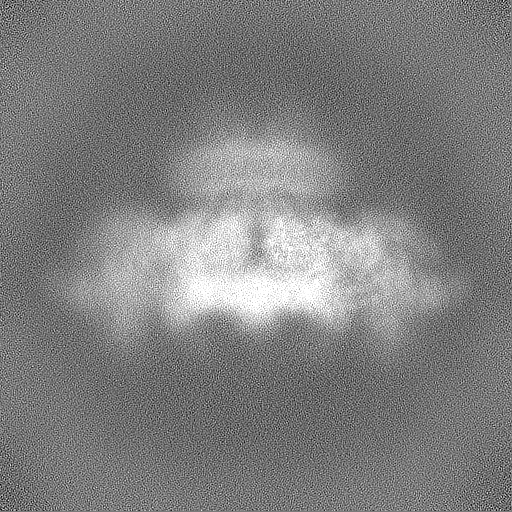
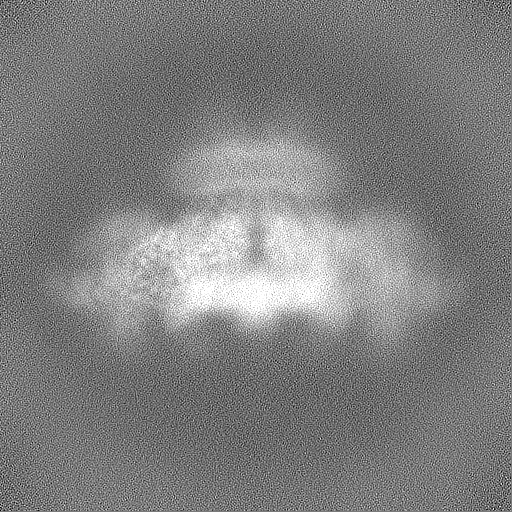
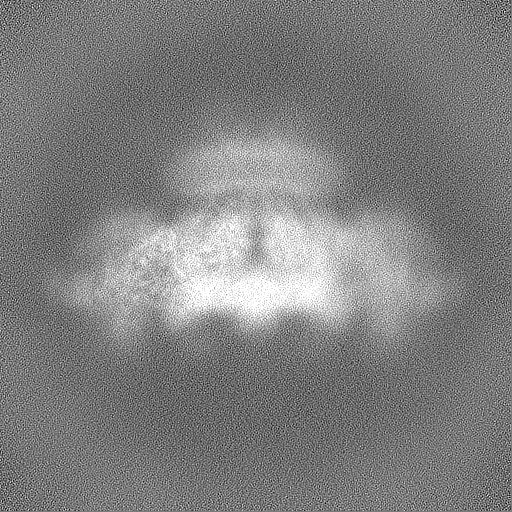
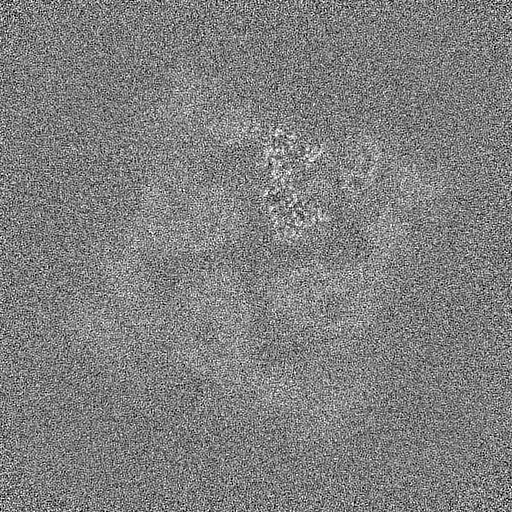
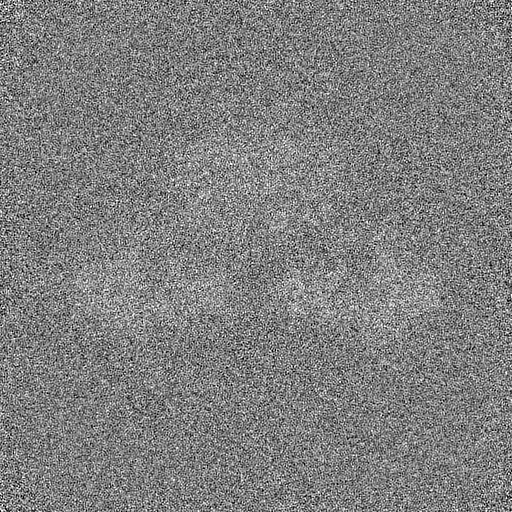
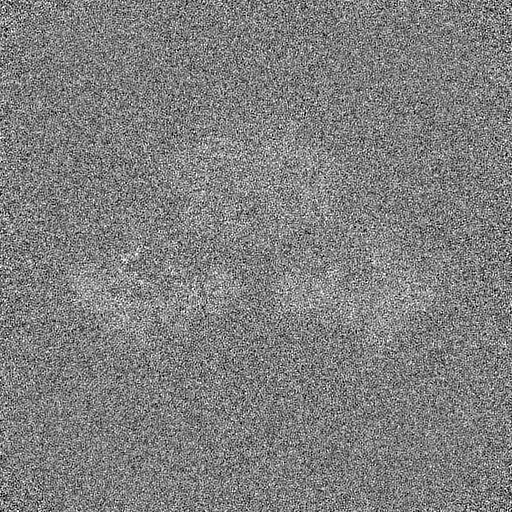
Entire : Complex of RyR1 with Calstabin-1 and S100A1 (high-Ca2+/CFF/ATP)
Entire
Name: Complex of RyR1 with Calstabin-1 and S100A1 (high-Ca2+/CFF/ATP)
Components
Complex: Complex of RyR1 with Calstabin-1 and S100A1 (high-Ca2+/CFF/ATP)
-
Supramolecule #1: Complex of RyR1 with Calstabin-1 and S100A1 (high-Ca2+/CFF/ATP)
Supramolecule
Name: Complex of RyR1 with Calstabin-1 and S100A1 (high-Ca2+/CFF/ATP) type: complex / ID: 1 / Parent: 0 / Macromolecule list: #1-#3 / Details: 0.25 mM free Ca2+; 5 mM Caffeine; 10 mM ATP
In the structure databanks used in Yorodumi, some data are registered as the other names, "COVID-19 virus" and "2019-nCoV". Here are the details of the virus and the list of structure data.
Jan 31, 2019. EMDB accession codes are about to change! (news from PDBe EMDB page)
EMDB accession codes are about to change! (news from PDBe EMDB page)
The allocation of 4 digits for EMDB accession codes will soon come to an end. Whilst these codes will remain in use, new EMDB accession codes will include an additional digit and will expand incrementally as the available range of codes is exhausted. The current 4-digit format prefixed with “EMD-” (i.e. EMD-XXXX) will advance to a 5-digit format (i.e. EMD-XXXXX), and so on. It is currently estimated that the 4-digit codes will be depleted around Spring 2019, at which point the 5-digit format will come into force.
The EM Navigator/Yorodumi systems omit the EMD- prefix.
Related info.:Q: What is EMD? / ID/Accession-code notation in Yorodumi/EM Navigator
Yorodumi is a browser for structure data from EMDB, PDB, SASBDB, etc.
This page is also the successor to EM Navigator detail page, and also detail information page/front-end page for Omokage search.
The word "yorodu" (or yorozu) is an old Japanese word meaning "ten thousand". "mi" (miru) is to see.
Related info.:EMDB / PDB / SASBDB / Comparison of 3 databanks / Yorodumi Search / Aug 31, 2016. New EM Navigator & Yorodumi / Yorodumi Papers / Jmol/JSmol / Function and homology information / Changes in new EM Navigator and Yorodumi
 Movie
Movie Controller

 Yorodumi
 Open data
 Basic information
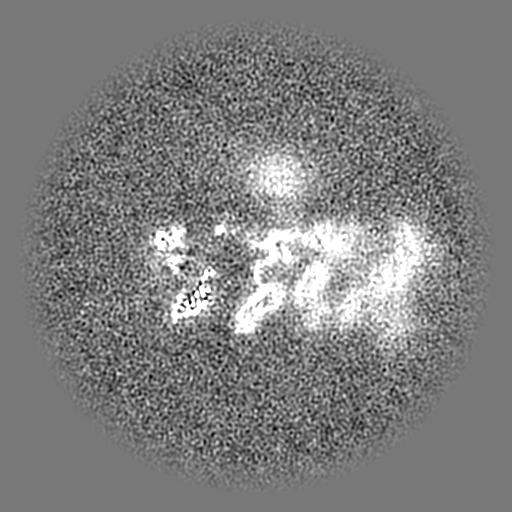
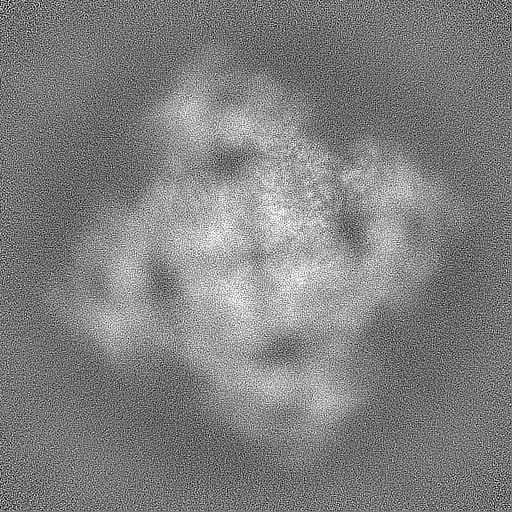
 Map data
 Sample
 Keywords
 Authors
 United States, 1 items
  Citation
 Structure visualization
 Downloads & links
 EMDB map data format
 emd_43301.png
 http://ftp.pdbj.org/pub/emdb/structures/EMD-43301


 Z (Sec.)
 Y (Row.)
 X (Col.)


 Sample components
 Processing
 Electron microscopy
 FIELD EMISSION GUN