 Movie
Movie Controller


+ Open data

- Basic information
| Entry |  | |||||||||
|---|---|---|---|---|---|---|---|---|---|---|
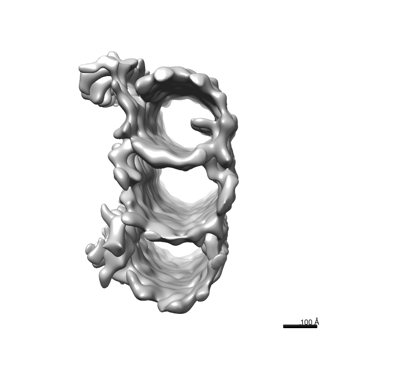
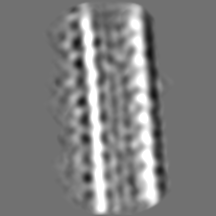
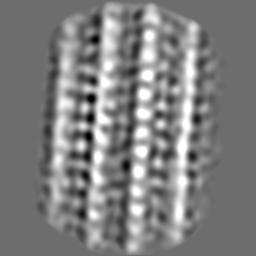
| Title | Subtomogram Averaging of the Triplet from Mouse Centrioles | |||||||||
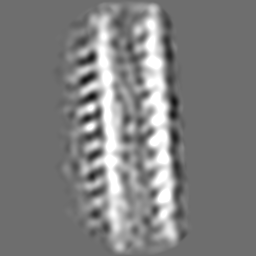
 Map data Map data | Subtomogram averaging of complete triplet from proximal centriole | |||||||||
 Sample Sample |
| |||||||||
 Keywords Keywords | Inhibitor / SIGNALING PROTEIN | |||||||||
| Biological species |  | |||||||||
| Method | subtomogram averaging / cryo EM / Resolution: 40.0 Å | |||||||||
 Authors Authors | Zhang Z / Moye A / He F / Chen M / Agosto AA / Wensel TG | |||||||||
| Funding support |  United States, 1 items United States, 1 items
| |||||||||
 Citation Citation | Journal: Life Sci Alliance / Year: 2024 Title: Centriole and transition zone structures in photoreceptor cilia revealed by cryo-electron tomography. Authors: Zhixian Zhang / Abigail R Moye / Feng He / Muyuan Chen / Melina A Agosto / Theodore G Wensel /   Abstract: Primary cilia mediate sensory signaling in multiple organisms and cell types but have structures adapted for specific roles. Structural defects in them lead to devastating diseases known as ...Primary cilia mediate sensory signaling in multiple organisms and cell types but have structures adapted for specific roles. Structural defects in them lead to devastating diseases known as ciliopathies in humans. Key to their functions are structures at their base: the basal body, the transition zone, the "Y-shaped links," and the "ciliary necklace." We have used cryo-electron tomography with subtomogram averaging and conventional transmission electron microscopy to elucidate the structures associated with the basal region of the "connecting cilia" of rod outer segments in mouse retina. The longitudinal variations in microtubule (MT) structures and the lumenal scaffold complexes connecting them have been determined, as well as membrane-associated transition zone structures: Y-shaped links connecting MT to the membrane, and ciliary beads connected to them that protrude from the cell surface and form a necklace-like structure. These results represent a clearer structural scaffold onto which molecules identified by genetics, proteomics, and superresolution fluorescence can be placed in our emerging model of photoreceptor sensory cilia. | |||||||||
| History |
|
- Structure visualization
| Supplemental images |
|---|
- Downloads & links
-EMDB archive
| Map data | emd_41812.map.gz | 49.6 MB |  EMDB map data format EMDB map data format | |
|---|---|---|---|---|
| Header (meta data) | emd-41812-v30.xmlemd-41812.xml | 18.6 KB 18.6 KB | Display Display | EMDB header |
| FSC (resolution estimation) | emd_41812_fsc.xml | 9.2 KB | Display | FSC data file |
| Images |  emd_41812.png emd_41812.png | 42.2 KB | ||
| Filedesc metadata | emd-41812.cif.gz | 4.4 KB | ||
| Others | emd_41812_additional_1.map.gzemd_41812_additional_2.map.gzemd_41812_additional_3.map.gzemd_41812_half_map_1.map.gzemd_41812_half_map_2.map.gz | 30.9 MB 16.3 MB 16.6 MB 38.7 MB 38.6 MB | ||
| Archive directory |  http://ftp.pdbj.org/pub/emdb/structures/EMD-41812ftp://ftp.pdbj.org/pub/emdb/structures/EMD-41812 http://ftp.pdbj.org/pub/emdb/structures/EMD-41812ftp://ftp.pdbj.org/pub/emdb/structures/EMD-41812 | HTTPS FTP |
-Validation report
| Summary document | emd_41812_validation.pdf.gz | 606.5 KB | Display | EMDB validaton report |
|---|---|---|---|---|
| Full document | emd_41812_full_validation.pdf.gz | 606.1 KB | Display | |
| Data in XML | emd_41812_validation.xml.gz | 13.9 KB | Display | |
| Data in CIF | emd_41812_validation.cif.gz | 21.9 KB | Display | |
| Arichive directory | https://ftp.pdbj.org/pub/emdb/validation_reports/EMD-41812ftp://ftp.pdbj.org/pub/emdb/validation_reports/EMD-41812 | HTTPS FTP |
-Related structure data

-Links
| EMDB pages | EMDB (EBI/PDBe) / EMDataResource |
|---|
-Map
| File | Download / File: emd_41812.map.gz / Format: CCP4 / Size: 64 MB / Type: IMAGE STORED AS FLOATING POINT NUMBER (4 BYTES) | ||||||||||||||||||||||||||||||||||||
|---|---|---|---|---|---|---|---|---|---|---|---|---|---|---|---|---|---|---|---|---|---|---|---|---|---|---|---|---|---|---|---|---|---|---|---|---|---|
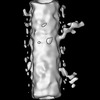
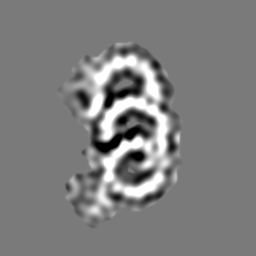
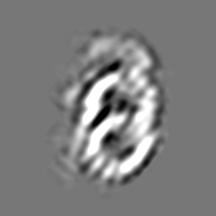
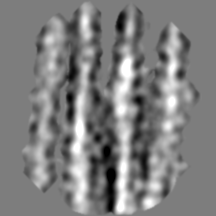
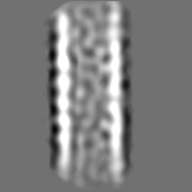
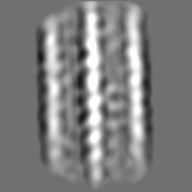
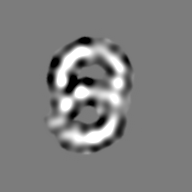
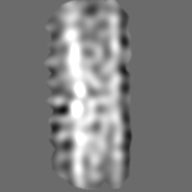
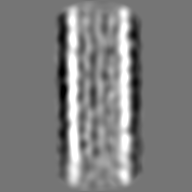
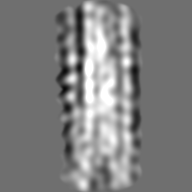
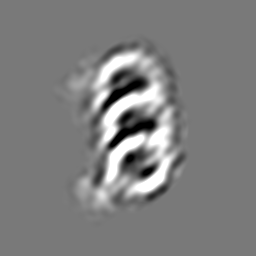
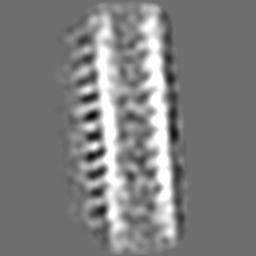
| Annotation | Subtomogram averaging of complete triplet from proximal centriole | ||||||||||||||||||||||||||||||||||||
| Projections & slices | Image control
Images are generated by Spider. | ||||||||||||||||||||||||||||||||||||
| Voxel size | X=Y=Z: 4.45 Å | ||||||||||||||||||||||||||||||||||||
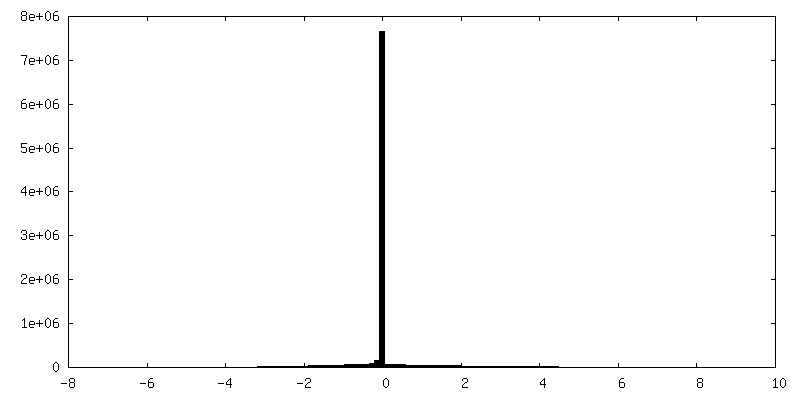
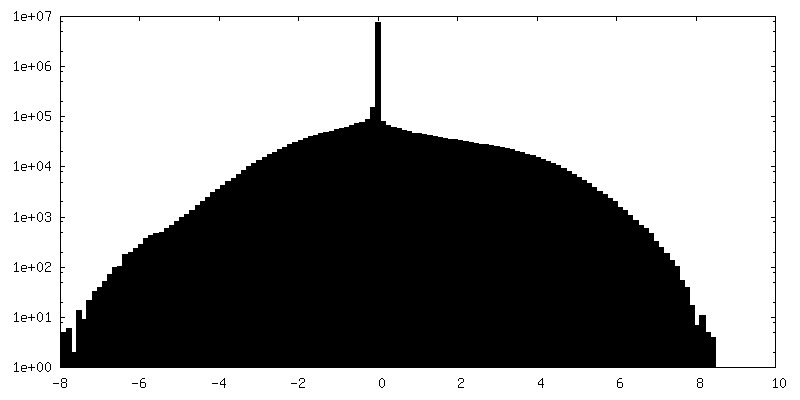
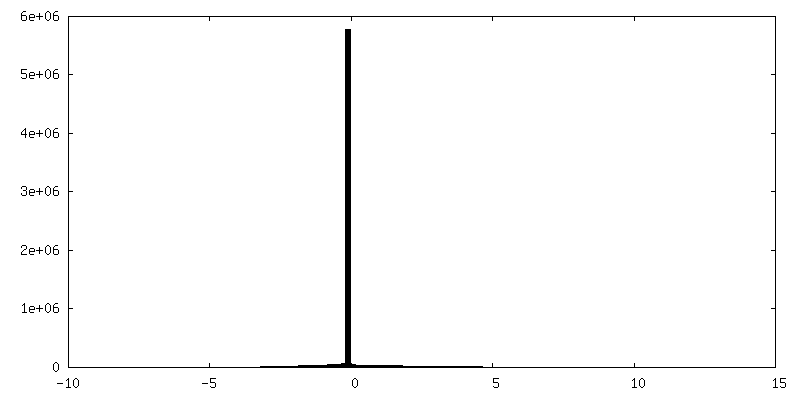
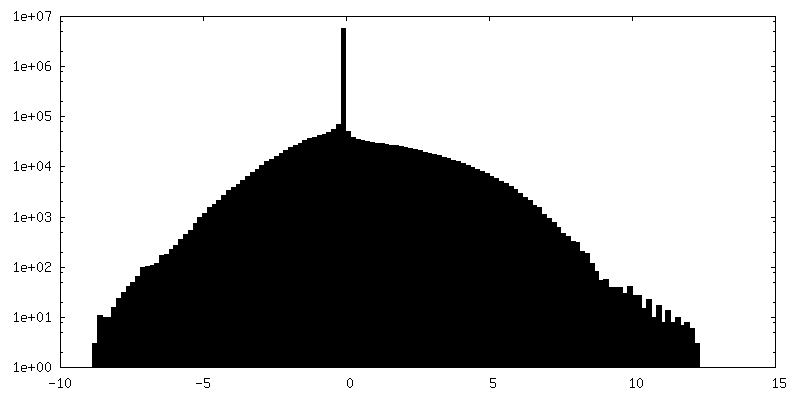
| Density |
| ||||||||||||||||||||||||||||||||||||
| Symmetry | Space group: 1 | ||||||||||||||||||||||||||||||||||||
| Details | EMDB XML:
|
 Z (Sec.)
 Y (Row.)
 X (Col.)


-Supplemental data
-Additional map: Subtomogram averaging of incomplete triplet from middle centriole
| File | emd_41812_additional_1.map | ||||||||||||
|---|---|---|---|---|---|---|---|---|---|---|---|---|---|
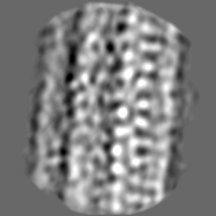
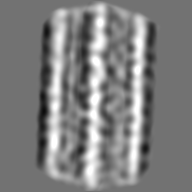
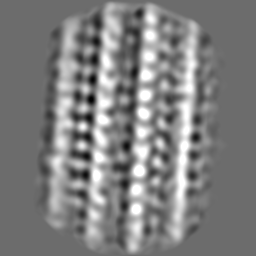
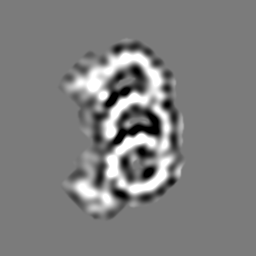
| Annotation | Subtomogram averaging of incomplete triplet from middle centriole | ||||||||||||
| Projections & Slices |
| ||||||||||||
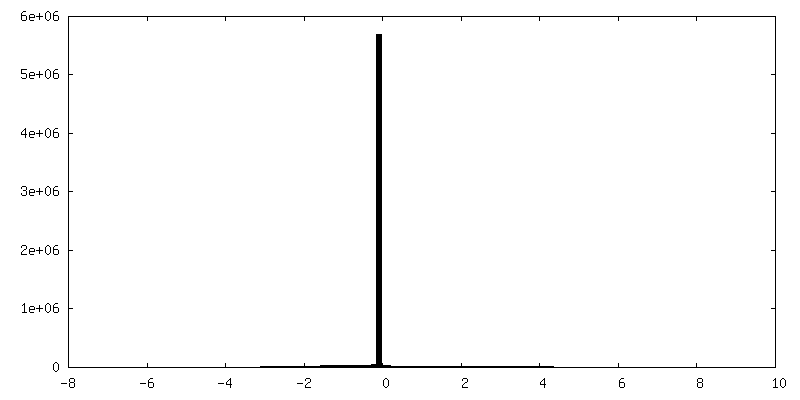
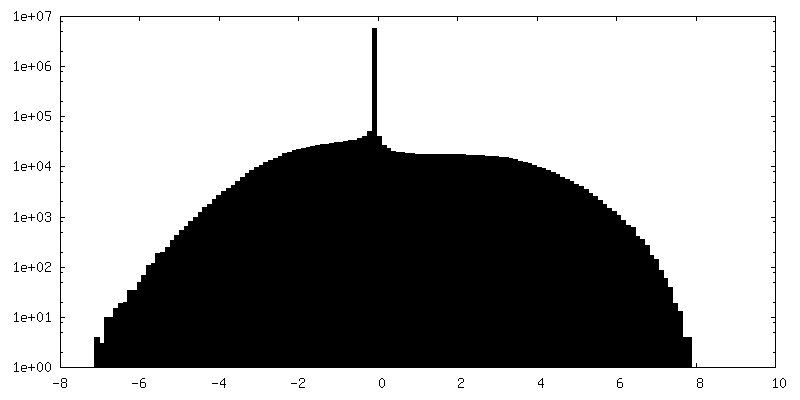
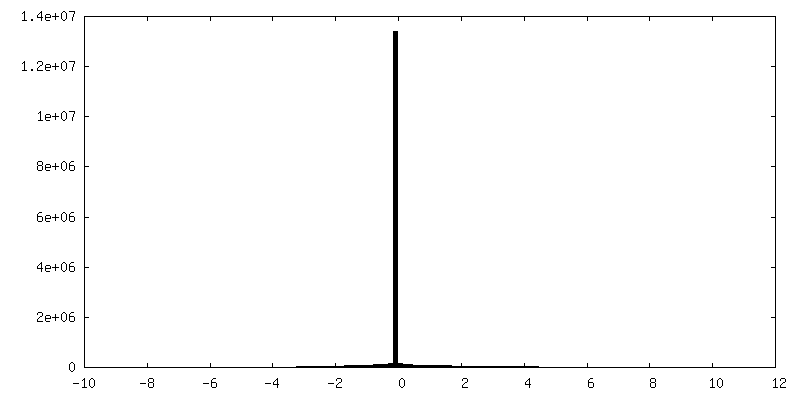
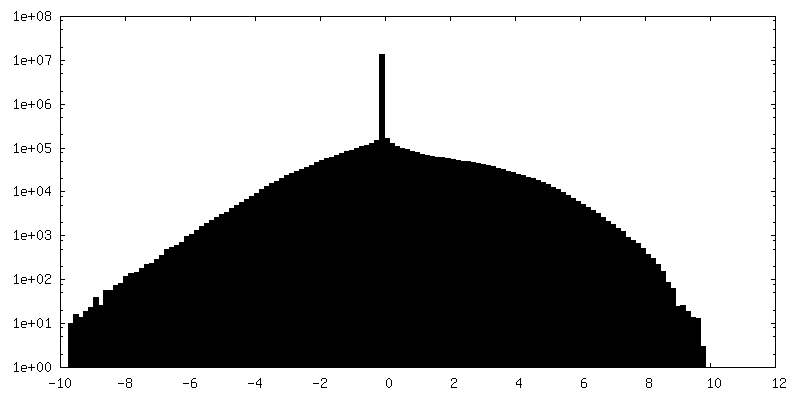
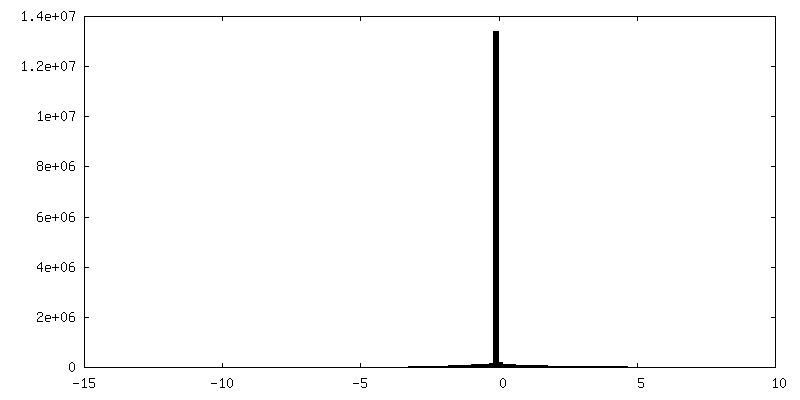
| Density Histograms |
-Additional map: Subtomogram averaging of doublets from distal centriole
| File | emd_41812_additional_2.map | ||||||||||||
|---|---|---|---|---|---|---|---|---|---|---|---|---|---|
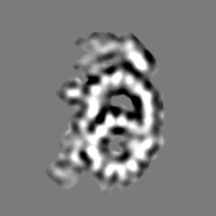
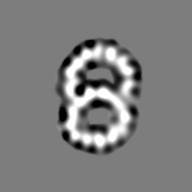
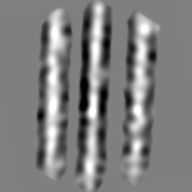
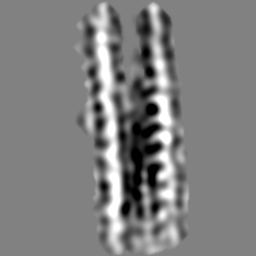
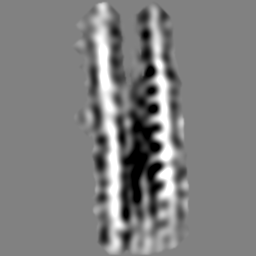
| Annotation | Subtomogram averaging of doublets from distal centriole | ||||||||||||
| Projections & Slices |
| ||||||||||||
| Density Histograms |


-Additional map: Subtomogram averaging of doublets from connecting cilium
| File | emd_41812_additional_3.map | ||||||||||||
|---|---|---|---|---|---|---|---|---|---|---|---|---|---|
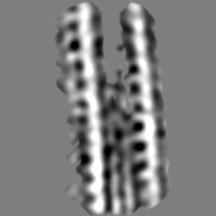
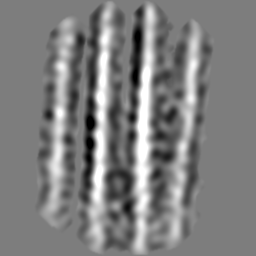
| Annotation | Subtomogram averaging of doublets from connecting cilium | ||||||||||||
| Projections & Slices |
| ||||||||||||
| Density Histograms |

-Half map: Masked odd half map
| File | emd_41812_half_map_1.map | ||||||||||||
|---|---|---|---|---|---|---|---|---|---|---|---|---|---|
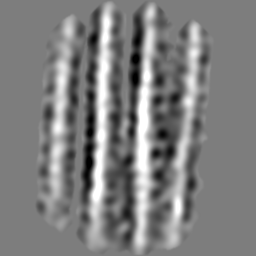
| Annotation | Masked odd half map | ||||||||||||
| Projections & Slices |
| ||||||||||||
| Density Histograms |


-Half map: Masked even half map
| File | emd_41812_half_map_2.map | ||||||||||||
|---|---|---|---|---|---|---|---|---|---|---|---|---|---|
| Annotation | Masked even half map | ||||||||||||
| Projections & Slices |
| ||||||||||||
| Density Histograms |

- Sample components
-Entire : ROS(rod of outer segments)of mouse photoreceptor
| Entire | Name: ROS(rod of outer segments)of mouse photoreceptor |
|---|---|
| Components |
|
-Supramolecule #1: ROS(rod of outer segments)of mouse photoreceptor
| Supramolecule | Name: ROS(rod of outer segments)of mouse photoreceptor / type: organelle_or_cellular_component / ID: 1 / Parent: 0 |
|---|---|
| Source (natural) | Organism: |
-Experimental details
-Structure determination
| Method | cryo EM |
|---|---|
 Processing Processing | subtomogram averaging |
| Aggregation state | cell |
-Sample preparation
| Buffer | pH: 7.5 |
|---|---|
| Grid | Model: Quantifoil R3.5/1 / Material: COPPER / Mesh: 200 |
| Vitrification | Cryogen name: ETHANE |
- Electron microscopy
| Microscope | FEI POLARA 300 |
|---|---|
| Image recording | Film or detector model: DIRECT ELECTRON DE-12 (4k x 3k) / Average exposure time: 1.0 sec. / Average electron dose: 10.0 e/Å2 |
| Electron beam | Acceleration voltage: 300 kV / Electron source:  FIELD EMISSION GUN FIELD EMISSION GUN |
| Electron optics | Illumination mode: FLOOD BEAM / Imaging mode: BRIGHT FIELD / Nominal defocus max: 1.2 µm / Nominal defocus min: 0.8 µm |
| Experimental equipment | 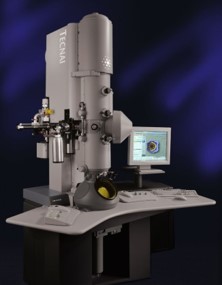 Model: Tecnai Polara / Image courtesy: FEI Company |
-Image processing
| Final reconstruction | Algorithm: BACK PROJECTION / Resolution.type: BY AUTHOR / Resolution: 40.0 Å / Resolution method: FSC 0.143 CUT-OFF / Number subtomograms used: 1800 |
|---|---|
| Extraction | Number tomograms: 15 / Number images used: 1800 |
| Final angle assignment | Type: PROJECTION MATCHING |
| FSC plot (resolution estimation) | 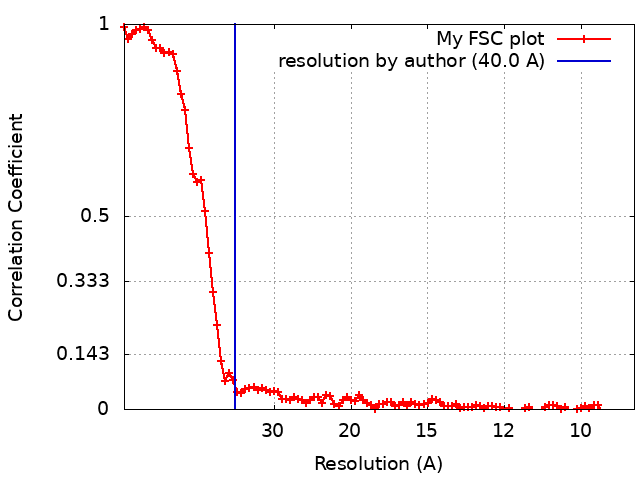 |
