 Movie
Movie Controller


+ Open data

- Basic information
| Entry |  | |||||||||
|---|---|---|---|---|---|---|---|---|---|---|
| Title | G1 mononucleosome | |||||||||
 Map data Map data | G1 mononucleosome class 1 | |||||||||
 Sample Sample |
| |||||||||
 Keywords Keywords | Cell / RPE-1 / nucleus / nucleosome / NUCLEAR PROTEIN | |||||||||
| Biological species |  Homo sapiens (human) Homo sapiens (human) | |||||||||
| Method | subtomogram averaging / cryo EM / Resolution: 33.7 Å | |||||||||
 Authors Authors | Chen JK / Cai S / Liu T / Ruan W / Ng CT / Shi J / Surana U / Gan L | |||||||||
| Funding support |  Singapore, 1 items Singapore, 1 items
| |||||||||
 Citation Citation | Journal: EMBO J / Year: 2025 Title: Nanoscale analysis of human G1 and metaphase chromatin in situ. Authors: Jon Ken Chen / Tingsheng Liu / Shujun Cai / Weimei Ruan / Cai Tong Ng / Jian Shi / Uttam Surana / Lu Gan /  Abstract: The structure of chromatin at the nucleosome level inside cells is still incompletely understood. Here we present in situ electron cryotomography analyses of chromatin in both G1 and metaphase RPE-1 ...The structure of chromatin at the nucleosome level inside cells is still incompletely understood. Here we present in situ electron cryotomography analyses of chromatin in both G1 and metaphase RPE-1 cells. G1 nucleosomes are concentrated in globular chromatin domains, and metaphase nucleosomes are concentrated in the chromatids. Classification analysis reveals that canonical mononucleosomes, and in some conditions ordered stacked dinucleosomes and mononucleosomes with a disordered gyre-proximal density, are abundant in both cell-cycle states. We do not detect class averages that have more than two stacked nucleosomes or side-by-side dinucleosomes, suggesting that groups of more than two nucleosomes are heterogeneous. Large multi-megadalton structures are abundant in G1 nucleoplasm, but not found in G1 chromatin domains and metaphase chromatin. The macromolecular phenotypes studied here represent a starting point for the comparative analysis of compaction in normal vs. unhealthy human cells, in other cell-cycle states, other organisms, and in vitro chromatin assemblies. | |||||||||
| History |
|
- Structure visualization
| Supplemental images |
|---|
- Downloads & links
-EMDB archive
| Map data | emd_36993.map.gz | 740.6 KB |  EMDB map data format EMDB map data format | |
|---|---|---|---|---|
| Header (meta data) | emd-36993-v30.xmlemd-36993.xml | 28.1 KB 28.1 KB | Display Display | EMDB header |
| Images |  emd_36993.png emd_36993.png | 39.7 KB | ||
| Filedesc metadata | emd-36993.cif.gz | 4.8 KB | ||
| Others | emd_36993_additional_1.map.gzemd_36993_additional_2.map.gzemd_36993_additional_3.map.gzemd_36993_additional_4.map.gzemd_36993_additional_5.map.gzemd_36993_additional_6.map.gzemd_36993_half_map_1.map.gzemd_36993_half_map_2.map.gz | 743.2 KB 739.3 KB 742.8 KB 740 KB 743 KB 740.1 KB 741.4 KB 741.9 KB | ||
| Archive directory |  http://ftp.pdbj.org/pub/emdb/structures/EMD-36993ftp://ftp.pdbj.org/pub/emdb/structures/EMD-36993 http://ftp.pdbj.org/pub/emdb/structures/EMD-36993ftp://ftp.pdbj.org/pub/emdb/structures/EMD-36993 | HTTPS FTP |
-Related structure data
| Related structure data | C: citing same article ( |
|---|


-Links
| EMDB pages | EMDB (EBI/PDBe) / EMDataResource |
|---|
-Map
| File | Download / File: emd_36993.map.gz / Format: CCP4 / Size: 1 MB / Type: IMAGE STORED AS FLOATING POINT NUMBER (4 BYTES) | ||||||||||||||||||||||||||||||||||||
|---|---|---|---|---|---|---|---|---|---|---|---|---|---|---|---|---|---|---|---|---|---|---|---|---|---|---|---|---|---|---|---|---|---|---|---|---|---|
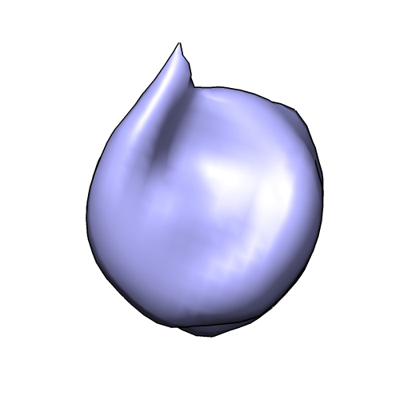
| Annotation | G1 mononucleosome class 1 | ||||||||||||||||||||||||||||||||||||
| Projections & slices | Image control
Images are generated by Spider. | ||||||||||||||||||||||||||||||||||||
| Voxel size | X=Y=Z: 6.766 Å | ||||||||||||||||||||||||||||||||||||
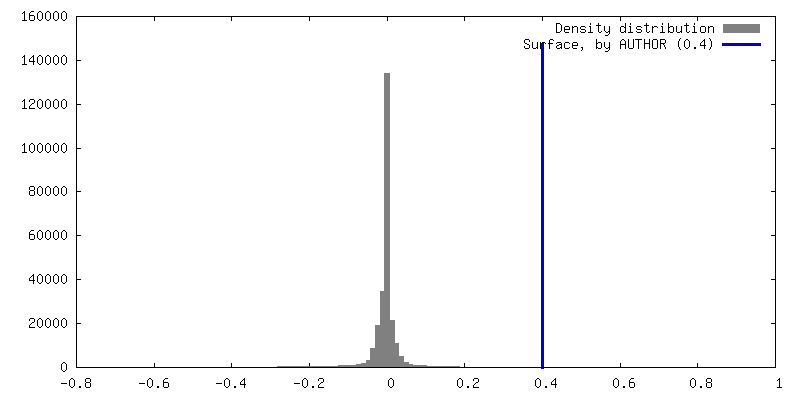
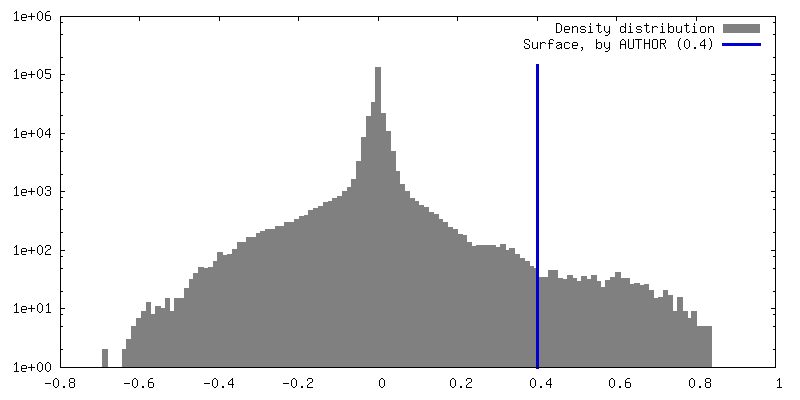
| Density |
| ||||||||||||||||||||||||||||||||||||
| Symmetry | Space group: 1 | ||||||||||||||||||||||||||||||||||||
| Details | EMDB XML:
|
 Z (Sec.)
 Y (Row.)
 X (Col.)


-Supplemental data
-Additional map: G1 mononucleosome class 4
| File | emd_36993_additional_1.map | ||||||||||||
|---|---|---|---|---|---|---|---|---|---|---|---|---|---|
| Annotation | G1 mononucleosome class 4 | ||||||||||||
| Projections & Slices |
| ||||||||||||
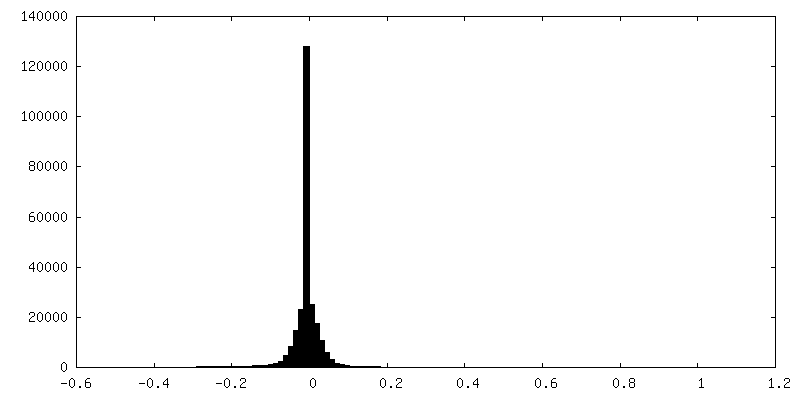
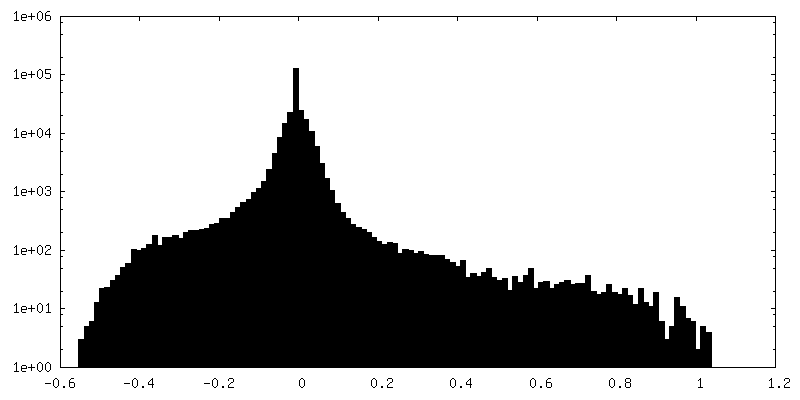
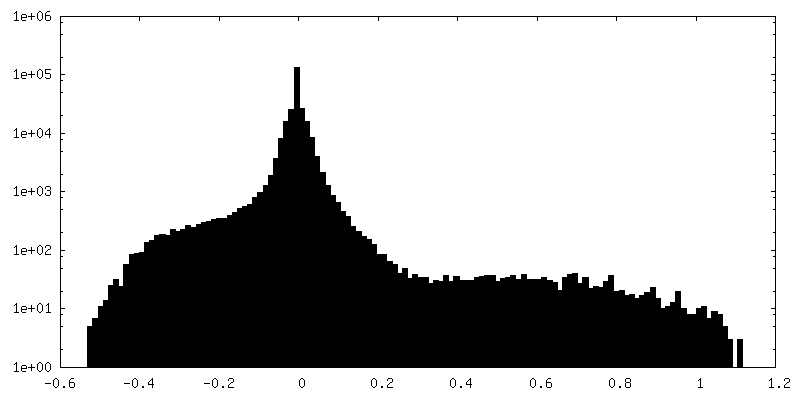
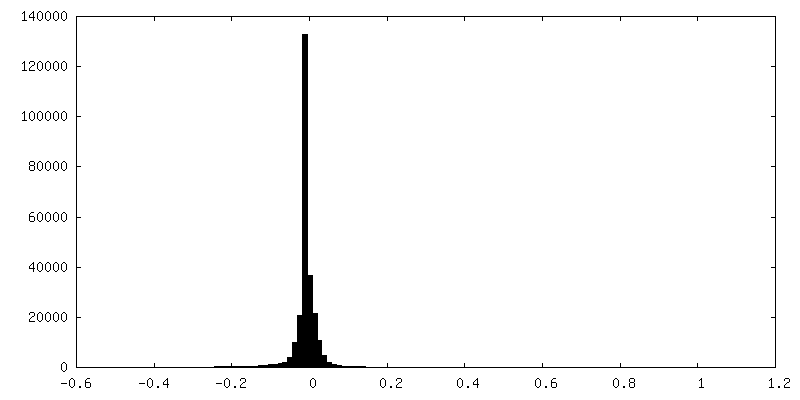
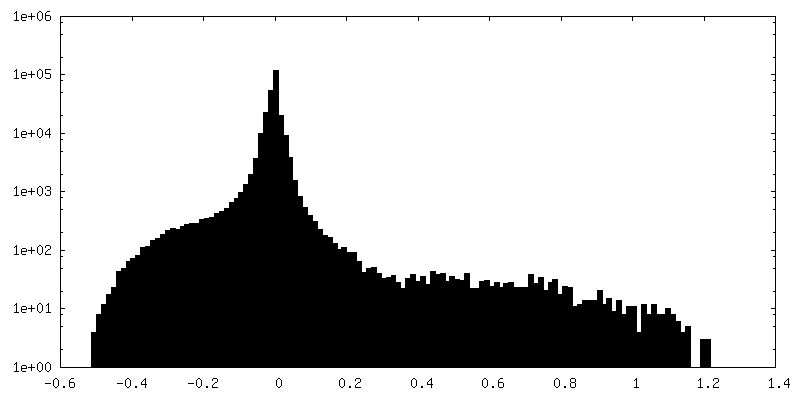
| Density Histograms |


-Additional map: G1 mononucleosome class 2
| File | emd_36993_additional_2.map | ||||||||||||
|---|---|---|---|---|---|---|---|---|---|---|---|---|---|
| Annotation | G1 mononucleosome class 2 | ||||||||||||
| Projections & Slices |
| ||||||||||||
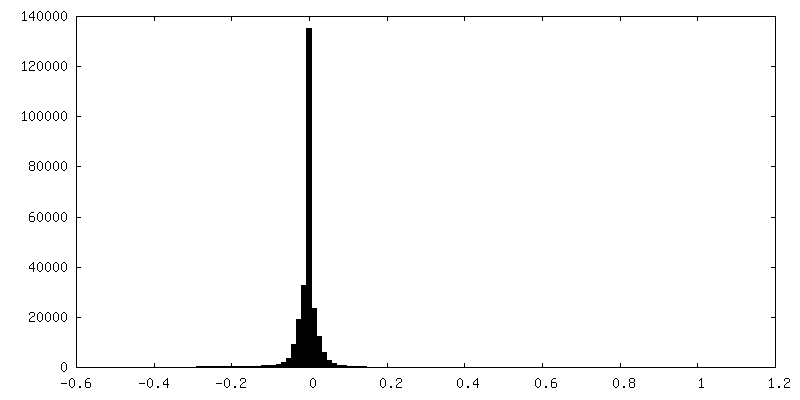
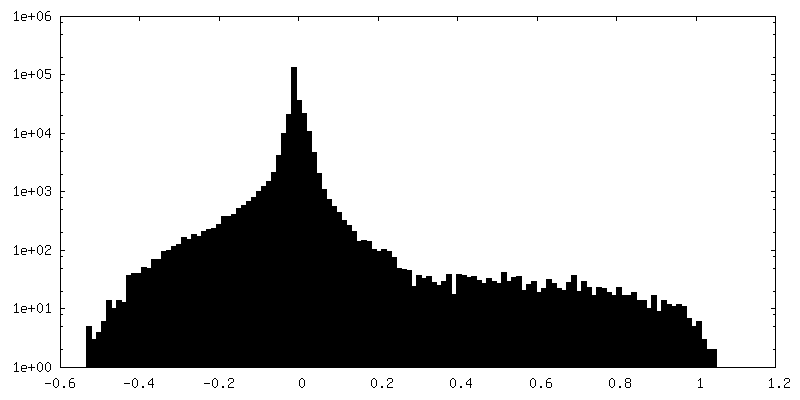
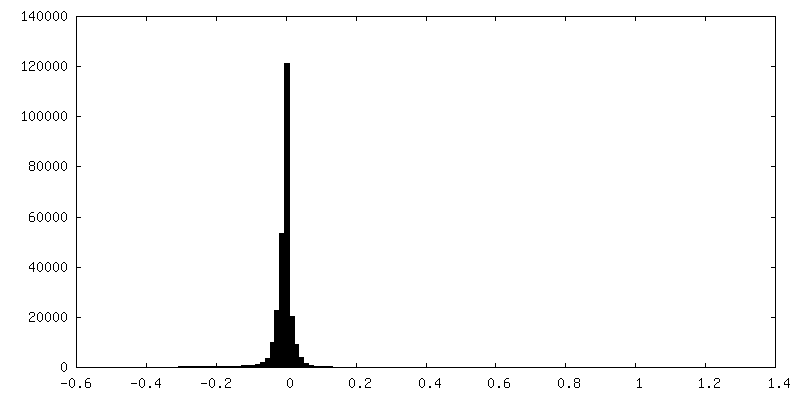
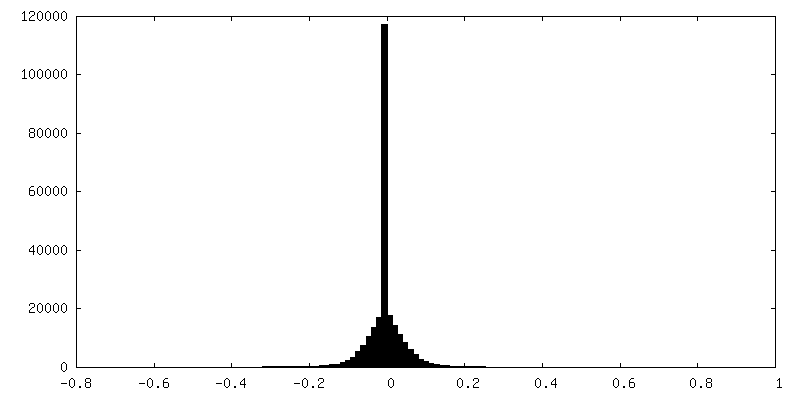
| Density Histograms |


-Additional map: G1 mononucleosome class 3
| File | emd_36993_additional_3.map | ||||||||||||
|---|---|---|---|---|---|---|---|---|---|---|---|---|---|
| Annotation | G1 mononucleosome class 3 | ||||||||||||
| Projections & Slices |
| ||||||||||||
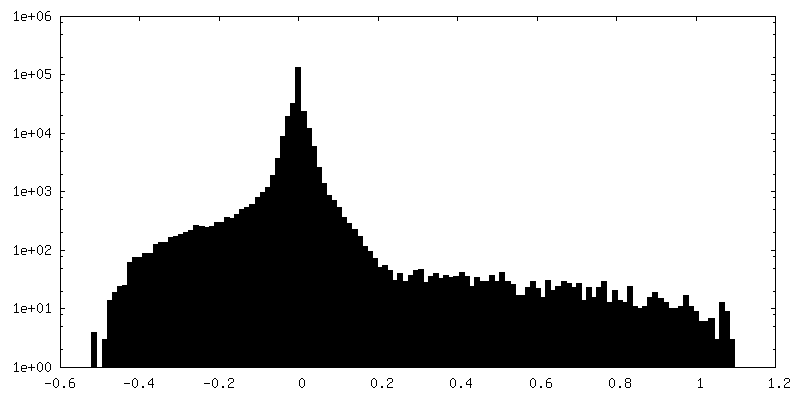
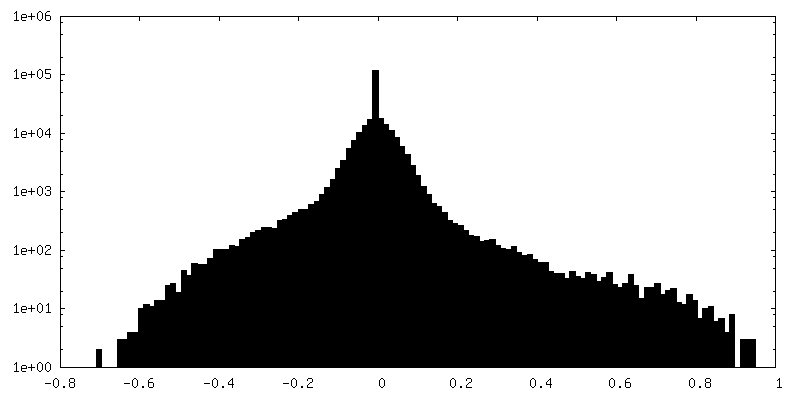
| Density Histograms |


-Additional map: G1 mononucleosome class 7
| File | emd_36993_additional_4.map | ||||||||||||
|---|---|---|---|---|---|---|---|---|---|---|---|---|---|
| Annotation | G1 mononucleosome class 7 | ||||||||||||
| Projections & Slices |
| ||||||||||||
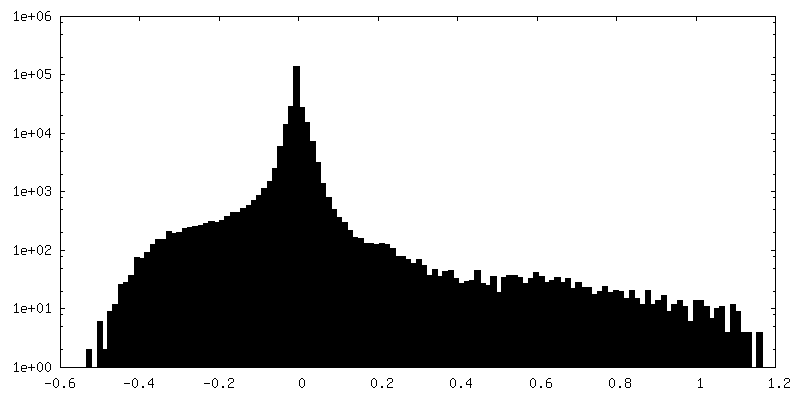
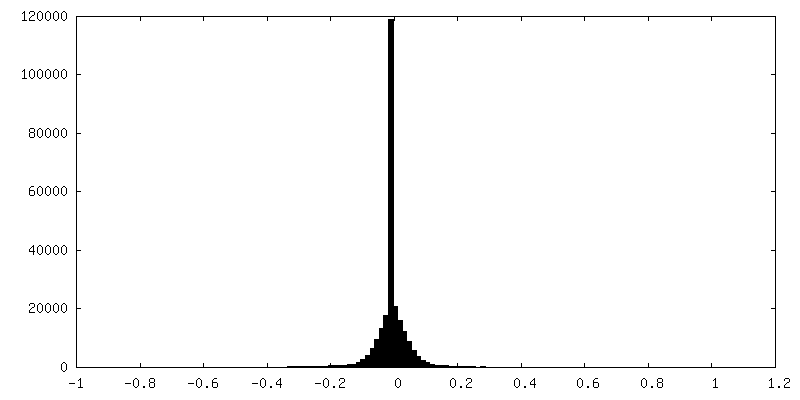
| Density Histograms |


-Additional map: G1 mononucleosome class 6
| File | emd_36993_additional_5.map | ||||||||||||
|---|---|---|---|---|---|---|---|---|---|---|---|---|---|
| Annotation | G1 mononucleosome class 6 | ||||||||||||
| Projections & Slices |
| ||||||||||||
| Density Histograms |


-Additional map: G1 mononucleosome class 5
| File | emd_36993_additional_6.map | ||||||||||||
|---|---|---|---|---|---|---|---|---|---|---|---|---|---|
| Annotation | G1 mononucleosome class 5 | ||||||||||||
| Projections & Slices |
| ||||||||||||
| Density Histograms |


-Half map: half map 2
| File | emd_36993_half_map_1.map | ||||||||||||
|---|---|---|---|---|---|---|---|---|---|---|---|---|---|
| Annotation | half map 2 | ||||||||||||
| Projections & Slices |
| ||||||||||||
| Density Histograms |


-Half map: half map 1
| File | emd_36993_half_map_2.map | ||||||||||||
|---|---|---|---|---|---|---|---|---|---|---|---|---|---|
| Annotation | half map 1 | ||||||||||||
| Projections & Slices |
| ||||||||||||
| Density Histograms |


- Sample components
-Entire : Nucleosome from RPE-1
| Entire | Name: Nucleosome from RPE-1 |
|---|---|
| Components |
|
-Supramolecule #1: Nucleosome from RPE-1
| Supramolecule | Name: Nucleosome from RPE-1 / type: complex / ID: 1 / Parent: 0 |
|---|---|
| Source (natural) | Organism: Homo sapiens (human) / Organelle: Nucleus |
-Experimental details
-Structure determination
| Method | cryo EM |
|---|---|
 Processing Processing | subtomogram averaging |
| Aggregation state | cell |
-Sample preparation
| Buffer | pH: 7 |
|---|---|
| Grid | Model: C-flat / Material: GOLD / Mesh: 200 / Support film - Material: CARBON / Support film - topology: HOLEY / Details: C-flat 2/4 |
| Vitrification | Cryogen name: ETHANE-PROPANE / Chamber humidity: 100 % / Chamber temperature: 277 K / Instrument: FEI VITROBOT MARK IV |
- Electron microscopy
| Microscope | FEI TITAN KRIOS |
|---|---|
| Specialist optics | Phase plate: VOLTA PHASE PLATE / Energy filter - Name: GIF Bioquantum / Energy filter - Slit width: 20 eV |
| Image recording | Film or detector model: GATAN K3 BIOQUANTUM (6k x 4k) / Detector mode: INTEGRATING / Digitization - Dimensions - Width: 5760 pixel / Digitization - Dimensions - Height: 4092 pixel / Number grids imaged: 1 / Average electron dose: 2.0 e/Å2 |
| Electron beam | Acceleration voltage: 300 kV / Electron source:  FIELD EMISSION GUN FIELD EMISSION GUN |
| Electron optics | Calibrated magnification: 30369 / Illumination mode: FLOOD BEAM / Imaging mode: BRIGHT FIELD / Nominal defocus max: 0.1 µm / Nominal defocus min: 0.1 µm / Nominal magnification: 18000 |
| Sample stage | Specimen holder model: FEI TITAN KRIOS AUTOGRID HOLDER / Cooling holder cryogen: NITROGEN |
| Experimental equipment |  Model: Titan Krios / Image courtesy: FEI Company |
