Movie
Movie Controller

[English] 日本語
 Yorodumi
- EMDB-24130: Exploration of subtle structural variability of ribosome assembly... -
+ Open data

- Basic information
| Entry | Database: EMDB / ID: EMD-24130 | |||||||||
|---|---|---|---|---|---|---|---|---|---|---|
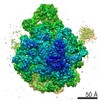
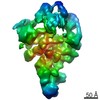
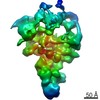
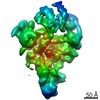
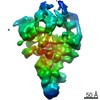
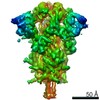
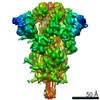
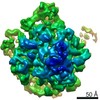
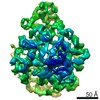
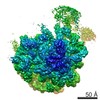
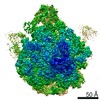
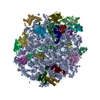
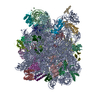
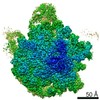
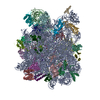
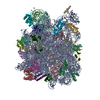
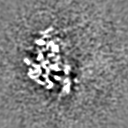
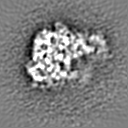
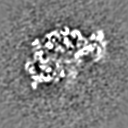
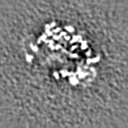
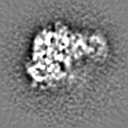
| Title | Exploration of subtle structural variability of ribosome assembly intermediates | |||||||||
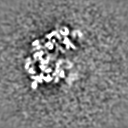
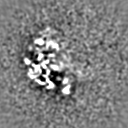
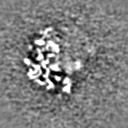
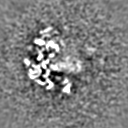
 Map data Map data | Exploration of subtle structural variability of ribosome assembly intermediates. | |||||||||
 Sample Sample |
| |||||||||
| Biological species |  | |||||||||
| Method | single particle reconstruction / cryo EM / Resolution: 8.0 Å | |||||||||
 Authors Authors | Chen M / Ludtke SJ | |||||||||
| Funding support |  United States, 1 items United States, 1 items
| |||||||||
 Citation Citation | Journal: Nat Methods / Year: 2021 Title: Deep learning-based mixed-dimensional Gaussian mixture model for characterizing variability in cryo-EM. Authors: Muyuan Chen / Steven J Ludtke / Abstract: Structural flexibility and/or dynamic interactions with other molecules is a critical aspect of protein function. Cryogenic electron microscopy (cryo-EM) provides direct visualization of individual ...Structural flexibility and/or dynamic interactions with other molecules is a critical aspect of protein function. Cryogenic electron microscopy (cryo-EM) provides direct visualization of individual macromolecules sampling different conformational and compositional states. While numerous methods are available for computational classification of discrete states, characterization of continuous conformational changes or large numbers of discrete state without human supervision remains challenging. Here we present e2gmm, a machine learning algorithm to determine a conformational landscape for proteins or complexes using a three-dimensional Gaussian mixture model mapped onto two-dimensional particle images in known orientations. Using a deep neural network architecture, e2gmm can automatically resolve the structural heterogeneity within the protein complex and map particles onto a small latent space describing conformational and compositional changes. This system presents a more intuitive and flexible representation than other manifold methods currently in use. We demonstrate this method on both simulated data and three biological systems to explore compositional and conformational changes at a range of scales. The software is distributed as part of EMAN2. | |||||||||
| History |
|
- Structure visualization
| Movie |
 Movie viewer Movie viewer |
|---|---|
| Structure viewer | EM map: SurfViewMolmilJmol/JSmol |
| Supplemental images |

- Downloads & links
-EMDB archive
| Map data | emd_24130.map.gz | 7.4 MB | EMDB map data format | |
|---|---|---|---|---|
| Header (meta data) | emd-24130-v30.xmlemd-24130.xml | 20.7 KB 20.7 KB | Display Display | EMDB header |
| Images | 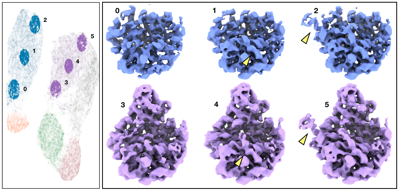 emd_24130.png emd_24130.png | 112.4 KB | ||
| Others | emd_24130_additional_1.map.gzemd_24130_additional_2.map.gzemd_24130_additional_3.map.gzemd_24130_additional_4.map.gzemd_24130_additional_5.map.gzemd_24130_additional_6.map.gz | 7.4 MB 7.4 MB 7.4 MB 7.4 MB 7.4 MB 7.4 MB | ||
| Archive directory |  http://ftp.pdbj.org/pub/emdb/structures/EMD-24130ftp://ftp.pdbj.org/pub/emdb/structures/EMD-24130 http://ftp.pdbj.org/pub/emdb/structures/EMD-24130ftp://ftp.pdbj.org/pub/emdb/structures/EMD-24130 | HTTPS FTP |
-Related structure data
| Related structure data | C: citing same article ( |
|---|---|
| Similar structure data |


-Links
| EMDB pages | EMDB (EBI/PDBe) / EMDataResource |
|---|---|
| Related items in Molecule of the Month |
-Map
| File | Download / File: emd_24130.map.gz / Format: CCP4 / Size: 8 MB / Type: IMAGE STORED AS FLOATING POINT NUMBER (4 BYTES) | ||||||||||||||||||||||||||||||||||||||||||||||||||||||||||||
|---|---|---|---|---|---|---|---|---|---|---|---|---|---|---|---|---|---|---|---|---|---|---|---|---|---|---|---|---|---|---|---|---|---|---|---|---|---|---|---|---|---|---|---|---|---|---|---|---|---|---|---|---|---|---|---|---|---|---|---|---|---|
| Annotation | Exploration of subtle structural variability of ribosome assembly intermediates. | ||||||||||||||||||||||||||||||||||||||||||||||||||||||||||||
| Projections & slices | Image control
Images are generated by Spider. | ||||||||||||||||||||||||||||||||||||||||||||||||||||||||||||
| Voxel size | X=Y=Z: 2.62 Å | ||||||||||||||||||||||||||||||||||||||||||||||||||||||||||||
| Density |
| ||||||||||||||||||||||||||||||||||||||||||||||||||||||||||||
| Symmetry | Space group: 1 | ||||||||||||||||||||||||||||||||||||||||||||||||||||||||||||
| Details | EMDB XML:
CCP4 map header:
| ||||||||||||||||||||||||||||||||||||||||||||||||||||||||||||
 Z (Sec.)
 Y (Row.)
 X (Col.)


-Supplemental data
-Additional map: Exploration of subtle structural variability of ribosome assembly...
| File | emd_24130_additional_1.map | ||||||||||||
|---|---|---|---|---|---|---|---|---|---|---|---|---|---|
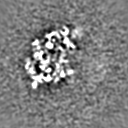
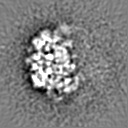
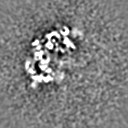
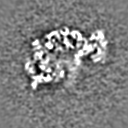
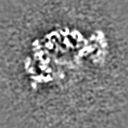
| Annotation | Exploration of subtle structural variability of ribosome assembly intermediates. Class 2. | ||||||||||||
| Projections & Slices |
| ||||||||||||
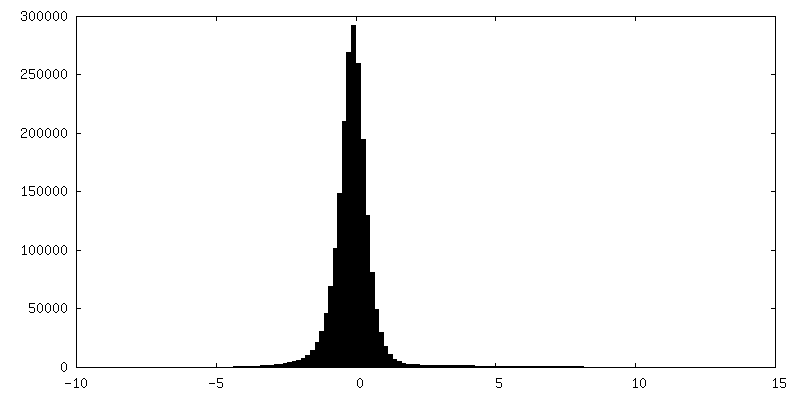
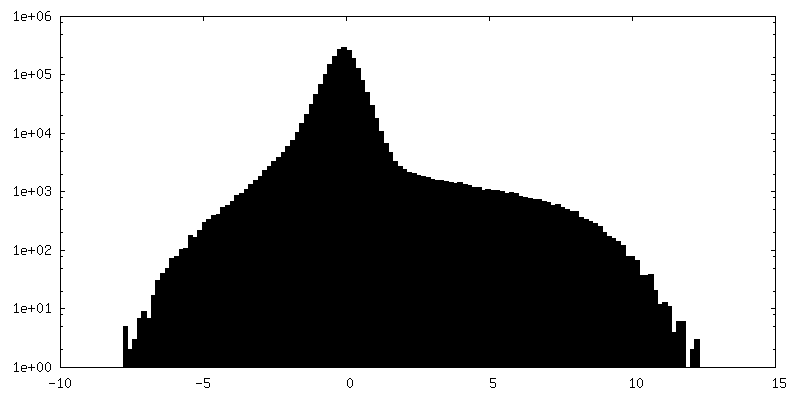
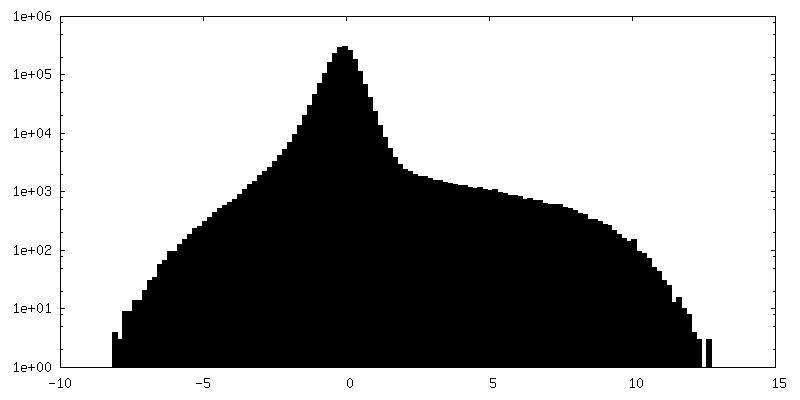
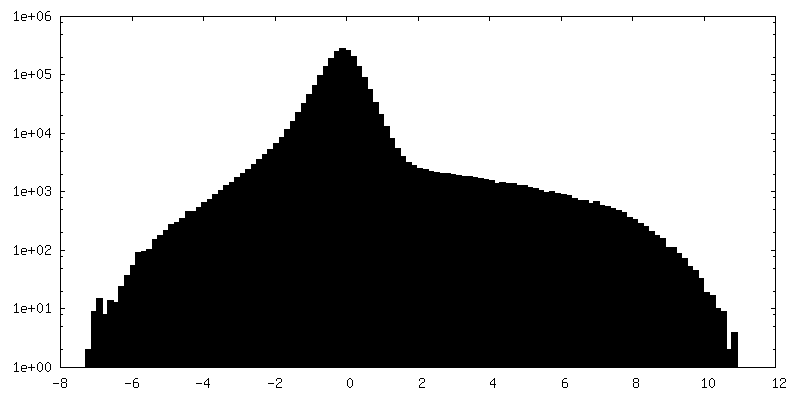
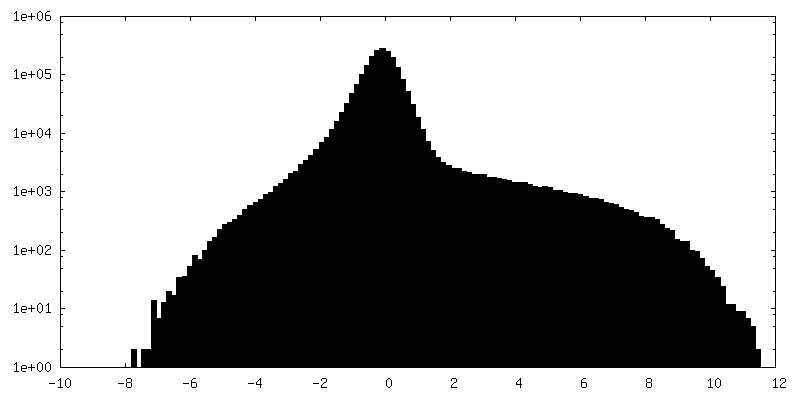
| Density Histograms |


-Additional map: Exploration of subtle structural variability of ribosome assembly...
| File | emd_24130_additional_2.map | ||||||||||||
|---|---|---|---|---|---|---|---|---|---|---|---|---|---|
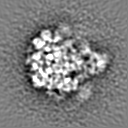
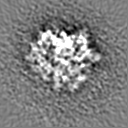
| Annotation | Exploration of subtle structural variability of ribosome assembly intermediates. Class 1. | ||||||||||||
| Projections & Slices |
| ||||||||||||
| Density Histograms |


-Additional map: Exploration of subtle structural variability of ribosome assembly...
| File | emd_24130_additional_3.map | ||||||||||||
|---|---|---|---|---|---|---|---|---|---|---|---|---|---|
| Annotation | Exploration of subtle structural variability of ribosome assembly intermediates. Class 0. | ||||||||||||
| Projections & Slices |
| ||||||||||||
| Density Histograms |


-Additional map: Exploration of subtle structural variability of ribosome assembly...
| File | emd_24130_additional_4.map | ||||||||||||
|---|---|---|---|---|---|---|---|---|---|---|---|---|---|
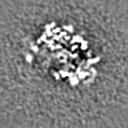
| Annotation | Exploration of subtle structural variability of ribosome assembly intermediates. Class 5. | ||||||||||||
| Projections & Slices |
| ||||||||||||
| Density Histograms |


-Additional map: Exploration of subtle structural variability of ribosome assembly...
| File | emd_24130_additional_5.map | ||||||||||||
|---|---|---|---|---|---|---|---|---|---|---|---|---|---|
| Annotation | Exploration of subtle structural variability of ribosome assembly intermediates. Class 4. | ||||||||||||
| Projections & Slices |
| ||||||||||||
| Density Histograms |


-Additional map: Exploration of subtle structural variability of ribosome assembly...
| File | emd_24130_additional_6.map | ||||||||||||
|---|---|---|---|---|---|---|---|---|---|---|---|---|---|
| Annotation | Exploration of subtle structural variability of ribosome assembly intermediates. Class 3. | ||||||||||||
| Projections & Slices |
| ||||||||||||
| Density Histograms |


- Sample components
-Entire : bL17-depleted large ribosomal subunit assembly intermediate
| Entire | Name: bL17-depleted large ribosomal subunit assembly intermediate |
|---|---|
| Components |
|
-Supramolecule #1: bL17-depleted large ribosomal subunit assembly intermediate
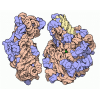
| Supramolecule | Name: bL17-depleted large ribosomal subunit assembly intermediate type: complex / ID: 1 / Parent: 0 |
|---|---|
| Source (natural) | Organism: |
-Experimental details
-Structure determination
| Method | cryo EM |
|---|---|
 Processing Processing | single particle reconstruction |
| Aggregation state | particle |
-Sample preparation
| Buffer | pH: 7 |
|---|---|
| Vitrification | Cryogen name: ETHANE |
- Electron microscopy
| Microscope | FEI TITAN KRIOS |
|---|---|
| Image recording | Film or detector model: GATAN K2 SUMMIT (4k x 4k) / Average electron dose: 34.0 e/Å2 |
| Electron beam | Acceleration voltage: 300 kV / Electron source:  FIELD EMISSION GUN FIELD EMISSION GUN |
| Electron optics | Illumination mode: FLOOD BEAM / Imaging mode: BRIGHT FIELD |
| Experimental equipment |  Model: Titan Krios / Image courtesy: FEI Company |
-Image processing
| Startup model | Type of model: EMDB MAP EMDB ID: |
|---|---|
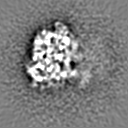
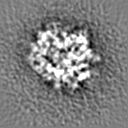
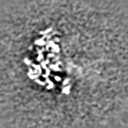
| Final reconstruction | Number classes used: 6 / Algorithm: FOURIER SPACE / Resolution.type: BY AUTHOR / Resolution: 8.0 Å / Resolution method: OTHER Details: 2000 particles are included in each class. The maps are filtered to 8A for visualization. Number images used: 2000 |
| Initial angle assignment | Type: PROJECTION MATCHING |
| Final angle assignment | Type: PROJECTION MATCHING / Software - Name: EMAN (ver. 2.91) |