 Movie
Movie Controller


+ Open data

- Basic information
| Entry | Database: EMDB / ID: EMD-1967 | |||||||||
|---|---|---|---|---|---|---|---|---|---|---|
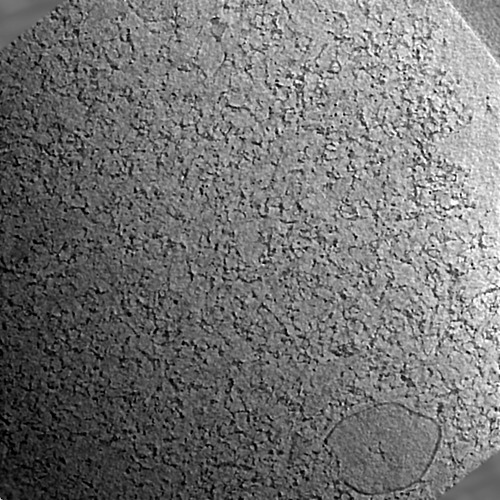
| Title | Cryo-electron tomography of the red blood cell cytoskeleton | |||||||||
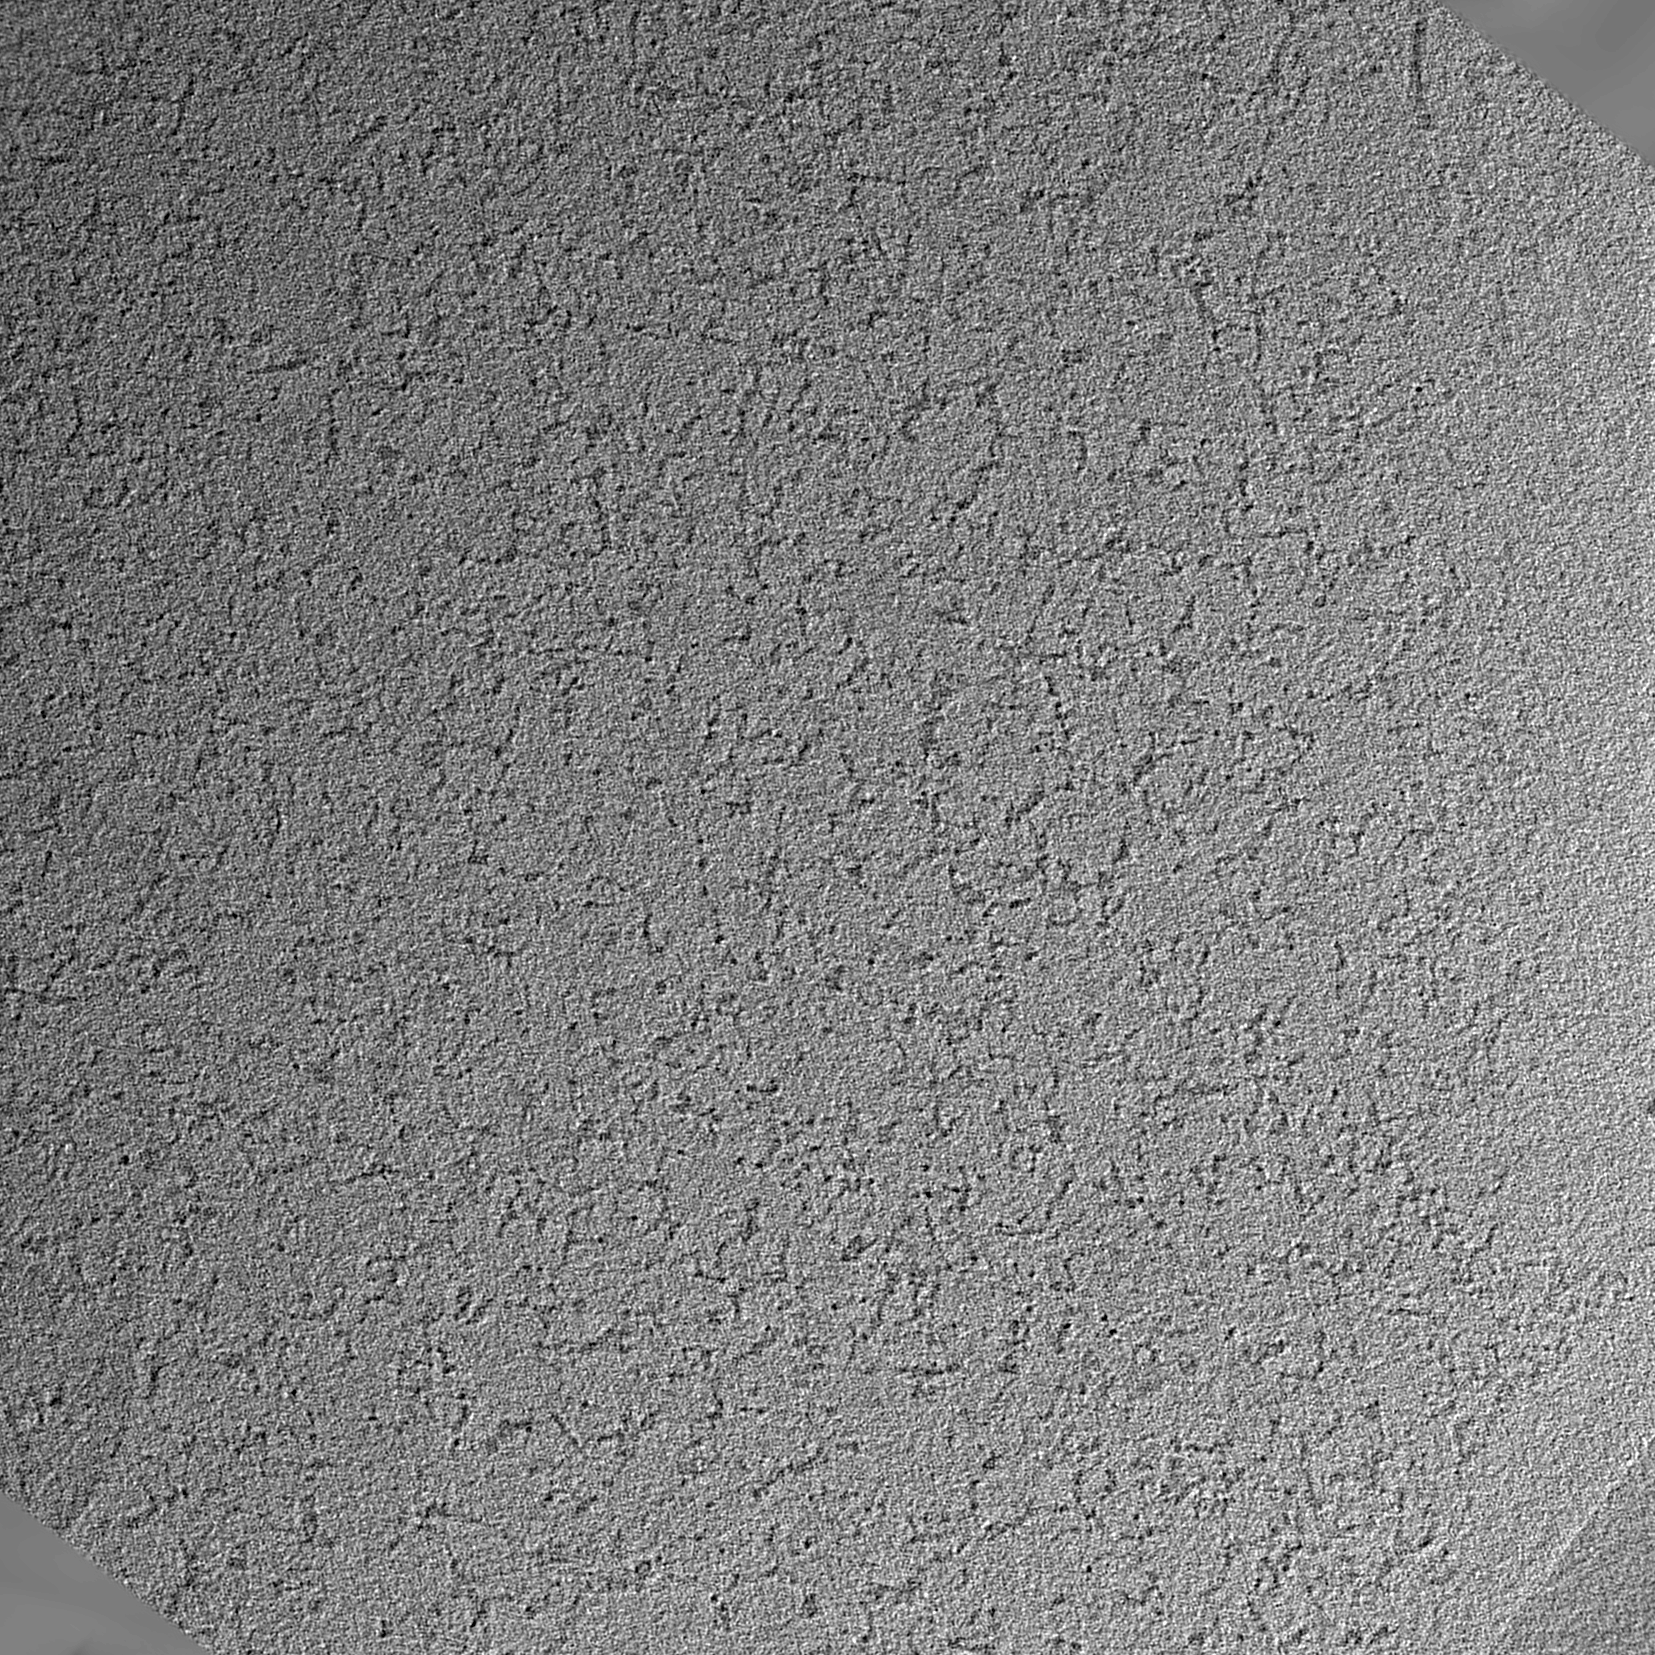
 Map data Map data | Cryo-electron tomogram of an isolated mouse red blood cell membrane skeleton after anisotropic diffusion | |||||||||
 Sample Sample |
| |||||||||
 Keywords Keywords | spectrin network / erythrocyte / membrane skeleton | |||||||||
| Biological species |  | |||||||||
| Method | electron tomography / cryo EM | |||||||||
 Authors Authors | Nans A / Mohandas N / Stokes DL | |||||||||
 Citation Citation | Journal: Biophys J / Year: 2011 Title: Native ultrastructure of the red cell cytoskeleton by cryo-electron tomography. Authors: Andrea Nans / Narla Mohandas / David L Stokes /  Abstract: Erythrocytes possess a spectrin-based cytoskeleton that provides elasticity and mechanical stability necessary to survive the shear forces within the microvasculature. The architecture of this ...Erythrocytes possess a spectrin-based cytoskeleton that provides elasticity and mechanical stability necessary to survive the shear forces within the microvasculature. The architecture of this membrane skeleton and the nature of its intermolecular contacts determine the mechanical properties of the skeleton and confer the characteristic biconcave shape of red cells. We have used cryo-electron tomography to evaluate the three-dimensional topology in intact, unexpanded membrane skeletons from mouse erythrocytes frozen in physiological buffer. The tomograms reveal a complex network of spectrin filaments converging at actin-based nodes and a gradual decrease in both the density and the thickness of the network from the center to the edge of the cell. The average contour length of spectrin filaments connecting junctional complexes is 46 ± 15 nm, indicating that the spectrin heterotetramer in the native membrane skeleton is a fraction of its fully extended length (∼190 nm). Higher-order oligomers of spectrin were prevalent, with hexamers and octamers seen between virtually every junctional complex in the network. Based on comparisons with expanded skeletons, we propose that the oligomeric state of spectrin is in a dynamic equilibrium that facilitates remodeling of the network as the cell changes shape in response to shear stress. | |||||||||
| History |
|
- Structure visualization
| Movie |
 Movie viewer Movie viewer |
|---|---|
| Structure viewer | EM map: SurfViewMolmilJmol/JSmol |
| Supplemental images |
- Downloads & links
-EMDB archive
| Map data | emd_1967.map.gz | 386 MB | EMDB map data format | |
|---|---|---|---|---|
| Header (meta data) | emd-1967-v30.xmlemd-1967.xml | 8.8 KB 8.8 KB | Display Display | EMDB header |
| Images | EMD-1967-sampleimage.tif | 275 KB | ||
| Others | emd_1967_additional_1.map.gz | 239.5 MB | ||
| Archive directory |  http://ftp.pdbj.org/pub/emdb/structures/EMD-1967ftp://ftp.pdbj.org/pub/emdb/structures/EMD-1967 http://ftp.pdbj.org/pub/emdb/structures/EMD-1967ftp://ftp.pdbj.org/pub/emdb/structures/EMD-1967 | HTTPS FTP |
-Validation report
| Summary document | emd_1967_validation.pdf.gz | 176.5 KB | Display | EMDB validaton report |
|---|---|---|---|---|
| Full document | emd_1967_full_validation.pdf.gz | 175.6 KB | Display | |
| Data in XML | emd_1967_validation.xml.gz | 5 KB | Display | |
| Arichive directory | https://ftp.pdbj.org/pub/emdb/validation_reports/EMD-1967ftp://ftp.pdbj.org/pub/emdb/validation_reports/EMD-1967 | HTTPS FTP |
-Links
| EMDB pages | EMDB (EBI/PDBe) / EMDataResource |
|---|
-Map
| File | Download / File: emd_1967.map.gz / Format: CCP4 / Size: 1.5 GB / Type: IMAGE STORED AS SIGNED INTEGER (2 BYTES) | ||||||||||||||||||||||||||||||||||||||||||||||||||||||||||||||||||||
|---|---|---|---|---|---|---|---|---|---|---|---|---|---|---|---|---|---|---|---|---|---|---|---|---|---|---|---|---|---|---|---|---|---|---|---|---|---|---|---|---|---|---|---|---|---|---|---|---|---|---|---|---|---|---|---|---|---|---|---|---|---|---|---|---|---|---|---|---|---|
| Annotation | Cryo-electron tomogram of an isolated mouse red blood cell membrane skeleton after anisotropic diffusion | ||||||||||||||||||||||||||||||||||||||||||||||||||||||||||||||||||||
| Projections & slices | Image control
Images are generated by Spider. generated in cubic-lattice coordinate | ||||||||||||||||||||||||||||||||||||||||||||||||||||||||||||||||||||
| Voxel size | X=Y=Z: 7.3 Å | ||||||||||||||||||||||||||||||||||||||||||||||||||||||||||||||||||||
| Density |
| ||||||||||||||||||||||||||||||||||||||||||||||||||||||||||||||||||||
| Symmetry | Space group: 1 | ||||||||||||||||||||||||||||||||||||||||||||||||||||||||||||||||||||
| Details | EMDB XML:
CCP4 map header:
| ||||||||||||||||||||||||||||||||||||||||||||||||||||||||||||||||||||
 Z (Sec.)
 Y (Row.)
 X (Col.)


-Supplemental data
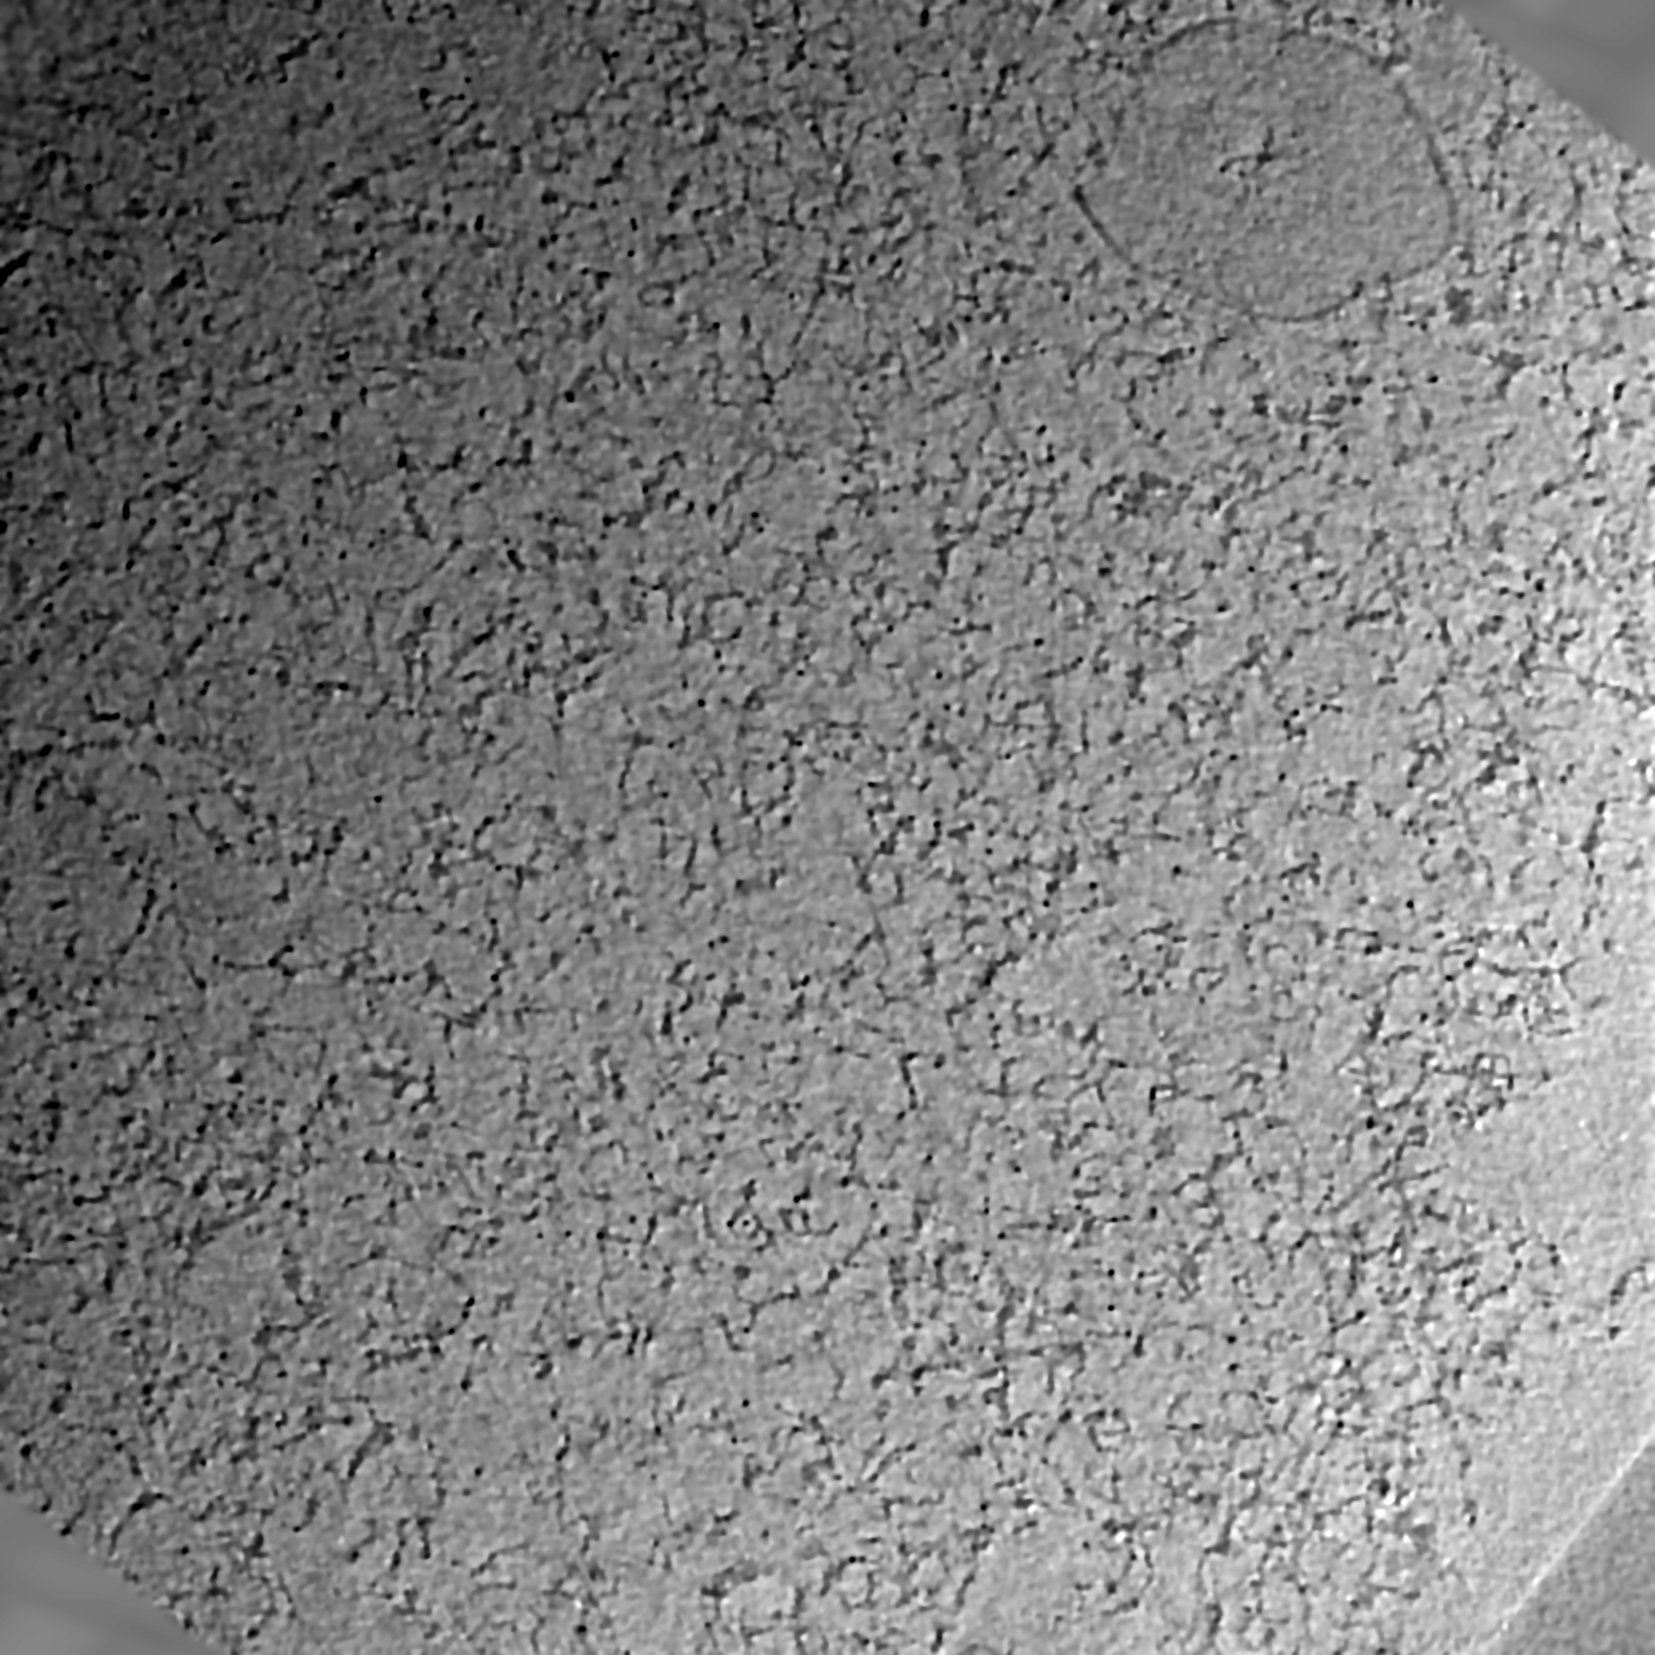
-Supplemental map: emd 1967 additional 1.map
| File | emd_1967_additional_1.map | ||||||||||||
|---|---|---|---|---|---|---|---|---|---|---|---|---|---|
| Projections & Slices |
| ||||||||||||
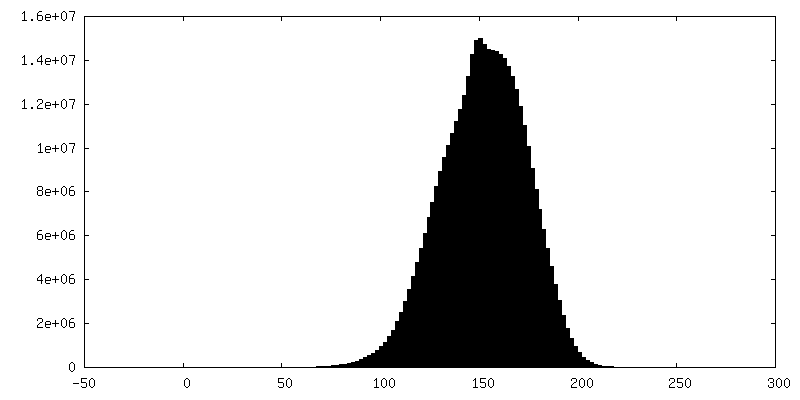
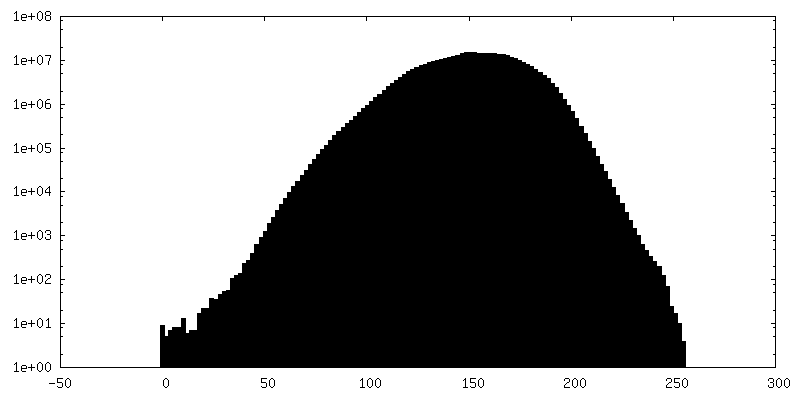
| Density Histograms |


- Sample components
-Entire : Mouse red blood cell cytoskeleton
| Entire | Name: Mouse red blood cell cytoskeleton |
|---|---|
| Components |
|
-Supramolecule #1000: Mouse red blood cell cytoskeleton
| Supramolecule | Name: Mouse red blood cell cytoskeleton / type: sample / ID: 1000 / Number unique components: 1 |
|---|
-Supramolecule #1: Cytoskeleton
| Supramolecule | Name: Cytoskeleton / type: organelle_or_cellular_component / ID: 1 / Name.synonym: Membrane skeleton / Number of copies: 1 / Recombinant expression: No / Database: NCBI |
|---|---|
| Source (natural) | Organism: |
-Experimental details
-Structure determination
| Method | cryo EM |
|---|---|
 Processing Processing | electron tomography |
-Sample preparation
| Concentration | 0.2 mg/mL |
|---|---|
| Buffer | pH: 7.4 / Details: 2mM sodium phosphate |
| Grid | Details: 200 mesh molybdenum |
| Vitrification | Cryogen name: ETHANE / Chamber humidity: 100 % / Chamber temperature: 123 K / Instrument: HOMEMADE PLUNGER / Details: Vitrification instrument: homemade / Method: Blot for 5 seconds before plunging |
- Electron microscopy
| Microscope | JEOL 3200FSC |
|---|---|
| Temperature | Average: 84 K |
| Specialist optics | Energy filter - Name: omega / Energy filter - Lower energy threshold: 0.0 eV / Energy filter - Upper energy threshold: 20.0 eV |
| Date | Apr 20, 2010 |
| Image recording | Category: CCD / Film or detector model: GENERIC GATAN (4k x 4k) / Average electron dose: 70 e/Å2 |
| Electron beam | Acceleration voltage: 300 kV / Electron source:  FIELD EMISSION GUN FIELD EMISSION GUN |
| Electron optics | Calibrated magnification: 40859 / Illumination mode: FLOOD BEAM / Imaging mode: BRIGHT FIELD / Cs: 4.1 mm / Nominal defocus max: 9.0 µm / Nominal defocus min: 9.0 µm / Nominal magnification: 30000 |
| Sample stage | Specimen holder: side-entry / Specimen holder model: JEOL 3200FSC CRYOHOLDER / Tilt series - Axis1 - Min angle: -66 ° / Tilt series - Axis1 - Max angle: 66 ° / Tilt series - Axis1 - Angle increment: 2 ° |
-Image processing
| Final reconstruction | Algorithm: OTHER / Software - Name: Protomo / Number images used: 67 |
|---|
