 Movie
Movie Controller

[English] 日本語
 Yorodumi
- EMDB-19190: REEL analysis reconstructions of lumbricus terrestris erythrocruo... -
+ Open data

- Basic information
| Entry |  | |||||||||
|---|---|---|---|---|---|---|---|---|---|---|
| Title | REEL analysis reconstructions of lumbricus terrestris erythrocruorin (worm hemoglobin) | |||||||||
 Map data Map data | Reference reconstruction | |||||||||
 Sample Sample |
| |||||||||
 Keywords Keywords | stem-eels / eels / reel-em / energy loss / single-particle / elemental mapping / elastic bright field / reconstructed energy loss / METAL BINDING PROTEIN | |||||||||
| Biological species |  Lumbricus terrestris (common earthworm) Lumbricus terrestris (common earthworm) | |||||||||
| Method | single particle reconstruction / cryo EM / Resolution: 27.0 Å | |||||||||
 Authors Authors | Pfeil-Gardiner O / Murphy BJ | |||||||||
| Funding support |  Germany, European Union, 2 items Germany, European Union, 2 items
| |||||||||
 Citation Citation | Journal: Nat Methods / Year: 2024 Title: Elemental mapping in single-particle reconstructions by reconstructed electron energy-loss analysis. Authors: Olivia Pfeil-Gardiner / Higor Vinícius Dias Rosa / Dietmar Riedel / Yu Seby Chen / Dominique Lörks / Pirmin Kükelhan / Martin Linck / Heiko Müller / Filip Van Petegem / Bonnie J Murphy /  Abstract: For macromolecular structures determined by cryogenic electron microscopy, no technique currently exists for mapping elements to defined locations, leading to errors in the assignment of metals and ...For macromolecular structures determined by cryogenic electron microscopy, no technique currently exists for mapping elements to defined locations, leading to errors in the assignment of metals and other ions, cofactors, substrates, inhibitors and lipids that play essential roles in activity and regulation. Elemental mapping in the electron microscope is well established for dose-tolerant samples but is challenging for biological samples, especially in a cryo-preserved state. Here we combine electron energy-loss spectroscopy with single-particle image processing to allow elemental mapping in cryo-preserved macromolecular complexes. Proof-of-principle data show that our method, reconstructed electron energy-loss (REEL) analysis, allows a three-dimensional reconstruction of electron energy-loss spectroscopy data, such that a high total electron dose is accumulated across many copies of a complex. Working with two test samples, we demonstrate that we can reliably localize abundant elements. We discuss the current limitations of the method and potential future developments. | |||||||||
| History |
|
- Structure visualization
| Supplemental images |
|---|

- Downloads & links
-EMDB archive
| Map data | emd_19190.map.gz | 3.3 MB |  EMDB map data format EMDB map data format | |
|---|---|---|---|---|
| Header (meta data) | emd-19190-v30.xmlemd-19190.xml | 22.6 KB 22.6 KB | Display Display | EMDB header |
| FSC (resolution estimation) | emd_19190_fsc.xml | 4.9 KB | Display | FSC data file |
| Images |  emd_19190.png emd_19190.png | 116.3 KB | ||
| Filedesc metadata | emd-19190.cif.gz | 5 KB | ||
| Others | emd_19190_additional_1.map.gzemd_19190_additional_2.map.gzemd_19190_additional_3.map.gzemd_19190_half_map_1.map.gzemd_19190_half_map_2.map.gz | 4.4 MB 4.4 MB 4.4 MB 6 MB 6 MB | ||
| Archive directory |  http://ftp.pdbj.org/pub/emdb/structures/EMD-19190ftp://ftp.pdbj.org/pub/emdb/structures/EMD-19190 http://ftp.pdbj.org/pub/emdb/structures/EMD-19190ftp://ftp.pdbj.org/pub/emdb/structures/EMD-19190 | HTTPS FTP |
-Validation report
| Summary document | emd_19190_validation.pdf.gz | 675.6 KB | Display | EMDB validaton report |
|---|---|---|---|---|
| Full document | emd_19190_full_validation.pdf.gz | 675.1 KB | Display | |
| Data in XML | emd_19190_validation.xml.gz | 10.4 KB | Display | |
| Data in CIF | emd_19190_validation.cif.gz | 14 KB | Display | |
| Arichive directory | https://ftp.pdbj.org/pub/emdb/validation_reports/EMD-19190ftp://ftp.pdbj.org/pub/emdb/validation_reports/EMD-19190 | HTTPS FTP |
-Related structure data

-Links
| EMDB pages | EMDB (EBI/PDBe) / EMDataResource |
|---|
-Map
| File | Download / File: emd_19190.map.gz / Format: CCP4 / Size: 8.8 MB / Type: IMAGE STORED AS FLOATING POINT NUMBER (4 BYTES) | ||||||||||||||||||||||||||||||||||||
|---|---|---|---|---|---|---|---|---|---|---|---|---|---|---|---|---|---|---|---|---|---|---|---|---|---|---|---|---|---|---|---|---|---|---|---|---|---|
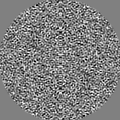
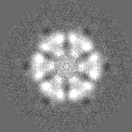
| Annotation | Reference reconstruction | ||||||||||||||||||||||||||||||||||||
| Projections & slices | Image control
Images are generated by Spider. | ||||||||||||||||||||||||||||||||||||
| Voxel size | X=Y=Z: 3.65 Å | ||||||||||||||||||||||||||||||||||||
| Density |
| ||||||||||||||||||||||||||||||||||||
| Symmetry | Space group: 1 | ||||||||||||||||||||||||||||||||||||
| Details | EMDB XML:
|
 Z (Sec.)
 Y (Row.)
 X (Col.)


-Supplemental data
-Additional map: Energy-loss map before the carbon K-edge generated by...
| File | emd_19190_additional_1.map | ||||||||||||
|---|---|---|---|---|---|---|---|---|---|---|---|---|---|
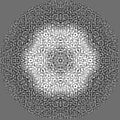
| Annotation | Energy-loss map before the carbon K-edge generated by summing REEL-EM maps in the energy range between and 237.5 eV to 242.1 eV. Best displayed with lowpass filtering. | ||||||||||||
| Projections & Slices |
| ||||||||||||
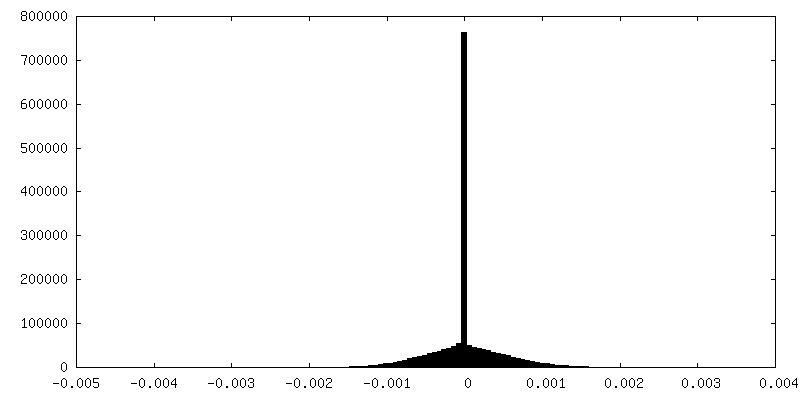
| Density Histograms |


-Additional map: Energy-loss map at the oxygen K-edge generated by...
| File | emd_19190_additional_2.map | ||||||||||||
|---|---|---|---|---|---|---|---|---|---|---|---|---|---|
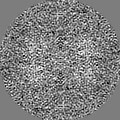
| Annotation | Energy-loss map at the oxygen K-edge generated by summing REEL-EM maps in the energy range between and 540.4 eV to 545.0 eV. Best displayed with lowpass filtering. | ||||||||||||
| Projections & Slices |
| ||||||||||||
| Density Histograms |


-Additional map: Energy-loss map at the carbon K-edge generated by...
| File | emd_19190_additional_3.map | ||||||||||||
|---|---|---|---|---|---|---|---|---|---|---|---|---|---|
| Annotation | Energy-loss map at the carbon K-edge generated by summing REEL-EM maps in the energy range between and 283.2 eV to 287.8 eV. Best displayed with lowpass filtering. | ||||||||||||
| Projections & Slices |
| ||||||||||||
| Density Histograms |


-Half map: Halfmap 1
| File | emd_19190_half_map_1.map | ||||||||||||
|---|---|---|---|---|---|---|---|---|---|---|---|---|---|
| Annotation | Halfmap 1 | ||||||||||||
| Projections & Slices |
| ||||||||||||
| Density Histograms |


-Half map: Halfmap 2
| File | emd_19190_half_map_2.map | ||||||||||||
|---|---|---|---|---|---|---|---|---|---|---|---|---|---|
| Annotation | Halfmap 2 | ||||||||||||
| Projections & Slices |
| ||||||||||||
| Density Histograms |


- Sample components
-Entire : Worm hemoglobin
| Entire | Name: Worm hemoglobin |
|---|---|
| Components |
|
-Supramolecule #1: Worm hemoglobin
| Supramolecule | Name: Worm hemoglobin / type: complex / ID: 1 / Parent: 0 / Macromolecule list: #1 |
|---|---|
| Source (natural) | Organism: Lumbricus terrestris (common earthworm) |
-Experimental details
-Structure determination
| Method | cryo EM |
|---|---|
 Processing Processing | single particle reconstruction |
| Aggregation state | particle |
-Sample preparation
| Buffer | pH: 7.3 |
|---|---|
| Grid | Model: C-flat-1.2/1.3 / Material: COPPER / Mesh: 300 / Support film - Material: CARBON / Support film - topology: HOLEY / Pretreatment - Type: GLOW DISCHARGE / Pretreatment - Time: 90 sec. |
| Vitrification | Cryogen name: ETHANE / Chamber humidity: 100 % / Chamber temperature: 277.15 K / Instrument: FEI VITROBOT MARK IV |
- Electron microscopy
| Microscope | TFS KRIOS |
|---|---|
| Specialist optics | Details: energy filter used in spectroscopy mode, so without a slit |
| Details | The data were collected as STEM-EELS spectral images. |
| Image recording | Film or detector model: DECTRIS ELA (1k x 0.5k) / Digitization - Dimensions - Width: 4096 pixel / Digitization - Dimensions - Height: 4096 pixel / Number real images: 1142 / Average electron dose: 92.0 e/Å2 |
| Electron beam | Acceleration voltage: 200 kV / Electron source:  FIELD EMISSION GUN FIELD EMISSION GUN |
| Electron optics | C2 aperture diameter: 50.0 µm / Calibrated defocus max: 0.0 µm / Calibrated defocus min: 0.0 µm / Illumination mode: OTHER / Imaging mode: OTHER / Cs: 2.7 mm / Nominal defocus max: 0.0 µm / Nominal defocus min: 0.0 µm / Nominal magnification: 80000 |
| Sample stage | Specimen holder model: FEI TITAN KRIOS AUTOGRID HOLDER / Cooling holder cryogen: NITROGEN |
| Experimental equipment |  Model: Titan Krios / Image courtesy: FEI Company |

