 Movie
Movie Controller

[English] 日本語
 Yorodumi
- EMDB-18697: Subtomogram average of Ebola virus nucleocapsid obtained from cry... -
+ Open data

- Basic information
| Entry |  | |||||||||
|---|---|---|---|---|---|---|---|---|---|---|
| Title | Subtomogram average of Ebola virus nucleocapsid obtained from cryo-FIB milled Ebola virus infected Huh7 cells at 22 hours post infection | |||||||||
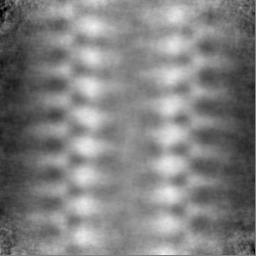
 Map data Map data | Subtomogram average Ebola condensed nucleocapsid from Ebola virus infected cells (low pass filtered to 21A resolution) | |||||||||
 Sample Sample |
| |||||||||
 Keywords Keywords | Ebola virus nucleocapsid / VIRUS | |||||||||
| Biological species |  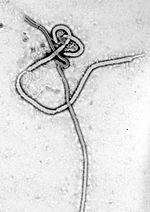 Ebola virus - Mayinga, Zaire, 1976 Ebola virus - Mayinga, Zaire, 1976 | |||||||||
| Method | subtomogram averaging / cryo EM / Resolution: 21.0 Å | |||||||||
 Authors Authors | Vallbracht M / Chlanda P | |||||||||
| Funding support |  Germany, 1 items Germany, 1 items
| |||||||||
 Citation Citation | Journal: Cell / Year: 2025 Title: Nucleocapsid assembly drives Ebola viral factory maturation and dispersion. Authors: Melina Vallbracht / Bianca S Bodmer / Konstantin Fischer / Jana Makroczyova / Sophie L Winter / Lisa Wendt / Moritz Wachsmuth-Melm / Thomas Hoenen / Petr Chlanda / Abstract: Replication and genome encapsidation of many negative-sense RNA viruses take place in virus-induced membraneless organelles termed viral factories (VFs). Although liquid properties of VFs are ...Replication and genome encapsidation of many negative-sense RNA viruses take place in virus-induced membraneless organelles termed viral factories (VFs). Although liquid properties of VFs are believed to control the transition from genome replication to nucleocapsid (NC) assembly, VF maturation and interactions with the cellular environment remain elusive. Here, we apply in situ cryo-correlative light and electron tomography to follow NC assembly and changes in VF morphology and their liquid properties during Ebola virus infection. We show that viral NCs transition from loosely packed helical assemblies in early VFs to compact cylinders that arrange into highly organized parallel bundles later in infection. Early VFs associate with intermediate filaments and are devoid of other host material but become progressively accessible to cellular components. Our data suggest that this process is coupled to VF solidification, loss of sphericity, and dispersion and promotes cytoplasmic exposure of NCs to facilitate their transport to budding sites. | |||||||||
| History |
|
- Structure visualization
| Supplemental images |
|---|

- Downloads & links
-EMDB archive
| Map data | emd_18697.map.gz | 58.6 MB |  EMDB map data format EMDB map data format | |
|---|---|---|---|---|
| Header (meta data) | emd-18697-v30.xmlemd-18697.xml | 14.8 KB 14.8 KB | Display Display | EMDB header |
| FSC (resolution estimation) | emd_18697_fsc.xml | 11.8 KB | Display | FSC data file |
| Images |  emd_18697.png emd_18697.png | 109.7 KB | ||
| Masks | emd_18697_msk_1.map | 64 MB | Mask map | |
| Filedesc metadata | emd-18697.cif.gz | 4.6 KB | ||
| Others | emd_18697_half_map_1.map.gzemd_18697_half_map_2.map.gz | 58.9 MB 59 MB | ||
| Archive directory |  http://ftp.pdbj.org/pub/emdb/structures/EMD-18697ftp://ftp.pdbj.org/pub/emdb/structures/EMD-18697 http://ftp.pdbj.org/pub/emdb/structures/EMD-18697ftp://ftp.pdbj.org/pub/emdb/structures/EMD-18697 | HTTPS FTP |
-Related structure data


-Links
| EMDB pages | EMDB (EBI/PDBe) / EMDataResource |
|---|
-Map
| File | Download / File: emd_18697.map.gz / Format: CCP4 / Size: 64 MB / Type: IMAGE STORED AS FLOATING POINT NUMBER (4 BYTES) | ||||||||||||||||||||||||||||||||||||
|---|---|---|---|---|---|---|---|---|---|---|---|---|---|---|---|---|---|---|---|---|---|---|---|---|---|---|---|---|---|---|---|---|---|---|---|---|---|
| Annotation | Subtomogram average Ebola condensed nucleocapsid from Ebola virus infected cells (low pass filtered to 21A resolution) | ||||||||||||||||||||||||||||||||||||
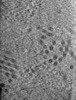
| Projections & slices | Image control
Images are generated by Spider. | ||||||||||||||||||||||||||||||||||||
| Voxel size | X=Y=Z: 2.671 Å | ||||||||||||||||||||||||||||||||||||
| Density |
| ||||||||||||||||||||||||||||||||||||
| Symmetry | Space group: 1 | ||||||||||||||||||||||||||||||||||||
| Details | EMDB XML:
|
 Z (Sec.)
 Y (Row.)
 X (Col.)


-Supplemental data
-Mask #1
| File | emd_18697_msk_1.map | ||||||||||||
|---|---|---|---|---|---|---|---|---|---|---|---|---|---|
| Projections & Slices |
| ||||||||||||
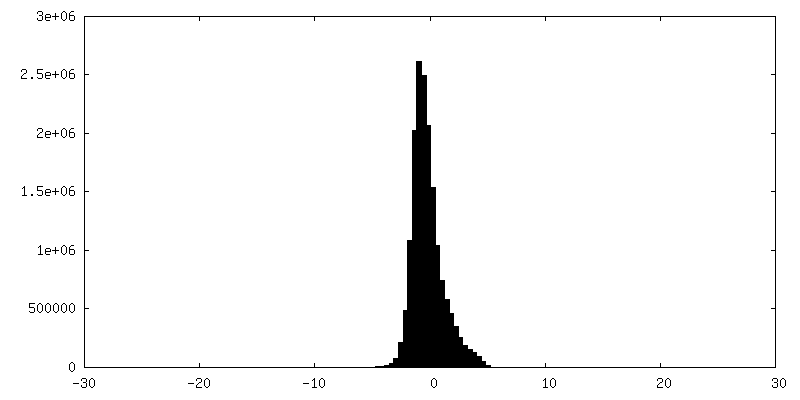
| Density Histograms |


-Half map: Subtomogram average half map of Ebola condensed nucleocapsid
| File | emd_18697_half_map_1.map | ||||||||||||
|---|---|---|---|---|---|---|---|---|---|---|---|---|---|
| Annotation | Subtomogram average half map of Ebola condensed nucleocapsid | ||||||||||||
| Projections & Slices |
| ||||||||||||
| Density Histograms |


-Half map: Subtomogram average half map of Ebola condensed nucleocapsid
| File | emd_18697_half_map_2.map | ||||||||||||
|---|---|---|---|---|---|---|---|---|---|---|---|---|---|
| Annotation | Subtomogram average half map of Ebola condensed nucleocapsid | ||||||||||||
| Projections & Slices |
| ||||||||||||
| Density Histograms |


- Sample components
-Entire : Ebola virus - Mayinga, Zaire, 1976
| Entire | Name: Ebola virus - Mayinga, Zaire, 1976 |
|---|---|
| Components |
|
-Supramolecule #1: Ebola virus - Mayinga, Zaire, 1976
| Supramolecule | Name: Ebola virus - Mayinga, Zaire, 1976 / type: virus / ID: 1 / Parent: 0 / NCBI-ID: 128952 / Sci species name: Ebola virus - Mayinga, Zaire, 1976 / Virus type: VIRION / Virus isolate: STRAIN / Virus enveloped: Yes / Virus empty: No |
|---|---|
| Virus shell | Shell ID: 1 / Name: Nucleocapsid / Diameter: 500.0 Å |
-Experimental details
-Structure determination
| Method | cryo EM |
|---|---|
 Processing Processing | subtomogram averaging |
| Aggregation state | cell |
-Sample preparation
| Buffer | pH: 7.4 |
|---|---|
| Grid | Model: Quantifoil / Material: GOLD / Mesh: 200 / Pretreatment - Type: GLOW DISCHARGE |
| Vitrification | Cryogen name: ETHANE |
- Electron microscopy
| Microscope | TFS KRIOS |
|---|---|
| Image recording | Film or detector model: GATAN K3 BIOQUANTUM (6k x 4k) / Average electron dose: 3.0 e/Å2 |
| Electron beam | Acceleration voltage: 300 kV / Electron source:  FIELD EMISSION GUN FIELD EMISSION GUN |
| Electron optics | Illumination mode: FLOOD BEAM / Imaging mode: BRIGHT FIELD / Nominal defocus max: 4.0 µm / Nominal defocus min: 2.5 µm / Nominal magnification: 33000 |
| Sample stage | Specimen holder model: FEI TITAN KRIOS AUTOGRID HOLDER / Cooling holder cryogen: NITROGEN |
| Experimental equipment |  Model: Titan Krios / Image courtesy: FEI Company |

