 Movie
Movie Controller

[English] 日本語
 Yorodumi
- EMDB-17664: Cami1-ribosome local refinement map with mask on Cami1 and L12-Cter -
+ Open data

- Basic information
| Entry |  | |||||||||
|---|---|---|---|---|---|---|---|---|---|---|
| Title | Cami1-ribosome local refinement map with mask on Cami1 and L12-Cter | |||||||||
 Map data Map data | ||||||||||
 Sample Sample |
| |||||||||
 Keywords Keywords | CRISPR / cyclic oligoadenylate / RNAse / RelE-toxin / RIBOSOME | |||||||||
| Biological species |  | |||||||||
| Method | single particle reconstruction / cryo EM / Resolution: 3.63 Å | |||||||||
 Authors Authors | Tamulaitiene G / Mogila I / Sasnauskas G / Tamulaitis G | |||||||||
| Funding support | Lithuania, 1 items
| |||||||||
 Citation Citation | Journal: Science / Year: 2023 Title: Ribosomal stalk-captured CARF-RelE ribonuclease inhibits translation following CRISPR signaling. Authors: Irmantas Mogila / Giedre Tamulaitiene / Konstanty Keda / Albertas Timinskas / Audrone Ruksenaite / Giedrius Sasnauskas / Česlovas Venclovas / Virginijus Siksnys / Gintautas Tamulaitis Abstract: Prokaryotic type III CRISPR-Cas antiviral systems employ cyclic oligoadenylate (cA) signaling to activate a diverse range of auxiliary proteins that reinforce the CRISPR-Cas defense. Here we ...Prokaryotic type III CRISPR-Cas antiviral systems employ cyclic oligoadenylate (cA) signaling to activate a diverse range of auxiliary proteins that reinforce the CRISPR-Cas defense. Here we characterize a class of cA-dependent effector proteins named CRISPR-Cas-associated messenger RNA (mRNA) interferase 1 (Cami1) consisting of a CRISPR-associated Rossmann fold sensor domain fused to winged helix-turn-helix and a RelE-family mRNA interferase domain. Upon activation by cyclic tetra-adenylate (cA), Cami1 cleaves mRNA exposed at the ribosomal A-site thereby depleting mRNA and leading to cell growth arrest. The structures of apo-Cami1 and the ribosome-bound Cami1-cA complex delineate the conformational changes that lead to Cami1 activation and the mechanism of Cami1 binding to a bacterial ribosome, revealing unexpected parallels with eukaryotic ribosome-inactivating proteins. | |||||||||
| History |
|
- Structure visualization
| Supplemental images |
|---|

- Downloads & links
-EMDB archive
| Map data | emd_17664.map.gz | 121.6 MB |  EMDB map data format EMDB map data format | |
|---|---|---|---|---|
| Header (meta data) | emd-17664-v30.xmlemd-17664.xml | 15.5 KB 15.5 KB | Display Display | EMDB header |
| FSC (resolution estimation) | emd_17664_fsc.xml | 18.2 KB | Display | FSC data file |
| Images | 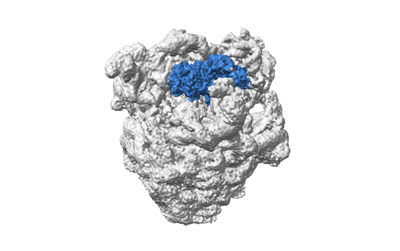 emd_17664.png emd_17664.png | 53.4 KB | ||
| Masks | emd_17664_msk_1.map | 244.1 MB | Mask map | |
| Filedesc metadata | emd-17664.cif.gz | 4.1 KB | ||
| Others | emd_17664_additional_1.map.gzemd_17664_half_map_1.map.gzemd_17664_half_map_2.map.gz | 123.1 MB 226.8 MB 226.8 MB | ||
| Archive directory |  http://ftp.pdbj.org/pub/emdb/structures/EMD-17664ftp://ftp.pdbj.org/pub/emdb/structures/EMD-17664 http://ftp.pdbj.org/pub/emdb/structures/EMD-17664ftp://ftp.pdbj.org/pub/emdb/structures/EMD-17664 | HTTPS FTP |
-Related structure data


-Links
| EMDB pages | EMDB (EBI/PDBe) / EMDataResource |
|---|
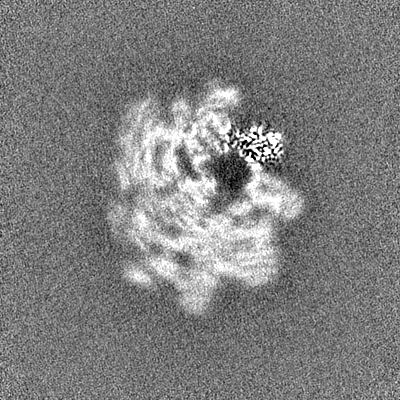
-Map
| File | Download / File: emd_17664.map.gz / Format: CCP4 / Size: 244.1 MB / Type: IMAGE STORED AS FLOATING POINT NUMBER (4 BYTES) | ||||||||||||||||||||||||||||||||||||
|---|---|---|---|---|---|---|---|---|---|---|---|---|---|---|---|---|---|---|---|---|---|---|---|---|---|---|---|---|---|---|---|---|---|---|---|---|---|
| Projections & slices | Image control
Images are generated by Spider. | ||||||||||||||||||||||||||||||||||||
| Voxel size | X=Y=Z: 1.12 Å | ||||||||||||||||||||||||||||||||||||
| Density |
| ||||||||||||||||||||||||||||||||||||
| Symmetry | Space group: 1 | ||||||||||||||||||||||||||||||||||||
| Details | EMDB XML:
|
 Z (Sec.)
 Y (Row.)
 X (Col.)


-Supplemental data
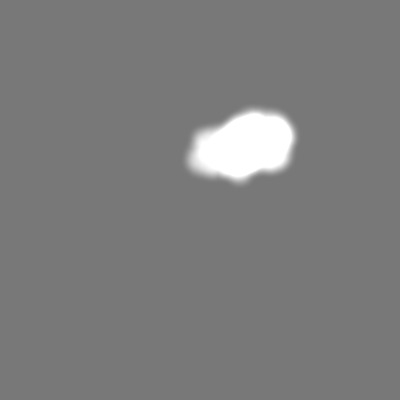
-Mask #1
| File | emd_17664_msk_1.map | ||||||||||||
|---|---|---|---|---|---|---|---|---|---|---|---|---|---|
| Projections & Slices |
| ||||||||||||
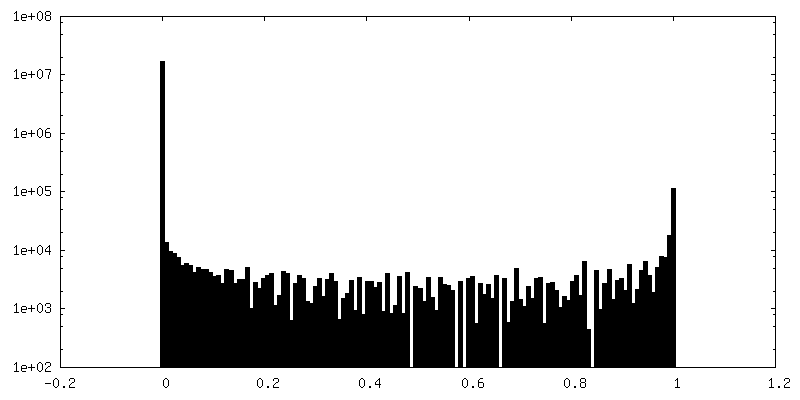
| Density Histograms |


-Additional map: Main cryo-EM map
| File | emd_17664_additional_1.map | ||||||||||||
|---|---|---|---|---|---|---|---|---|---|---|---|---|---|
| Annotation | Main cryo-EM map | ||||||||||||
| Projections & Slices |
| ||||||||||||
| Density Histograms |


-Half map: #2
| File | emd_17664_half_map_1.map | ||||||||||||
|---|---|---|---|---|---|---|---|---|---|---|---|---|---|
| Projections & Slices |
| ||||||||||||
| Density Histograms |


-Half map: #1
| File | emd_17664_half_map_2.map | ||||||||||||
|---|---|---|---|---|---|---|---|---|---|---|---|---|---|
| Projections & Slices |
| ||||||||||||
| Density Histograms |


- Sample components
-Entire : Cami1 bound in 70S E.coli ribosome
| Entire | Name: Cami1 bound in 70S E.coli ribosome |
|---|---|
| Components |
|
-Supramolecule #1: Cami1 bound in 70S E.coli ribosome
| Supramolecule | Name: Cami1 bound in 70S E.coli ribosome / type: complex / ID: 1 / Parent: 0 |
|---|---|
| Source (natural) | Organism: |
-Experimental details
-Structure determination
| Method | cryo EM |
|---|---|
 Processing Processing | single particle reconstruction |
| Aggregation state | particle |
-Sample preparation
| Buffer | pH: 7.5 |
|---|---|
| Grid | Model: Quantifoil R1.2/1.3 / Material: COPPER / Mesh: 300 / Support film - Material: CARBON / Support film - topology: HOLEY / Pretreatment - Type: GLOW DISCHARGE / Pretreatment - Time: 45 sec. / Pretreatment - Atmosphere: AIR |
| Vitrification | Cryogen name: ETHANE / Chamber humidity: 95 % / Chamber temperature: 277 K / Instrument: FEI VITROBOT MARK IV |
- Electron microscopy
| Microscope | TFS GLACIOS |
|---|---|
| Image recording | Film or detector model: FEI FALCON III (4k x 4k) / Detector mode: COUNTING / Average electron dose: 30.0 e/Å2 |
| Electron beam | Acceleration voltage: 200 kV / Electron source:  FIELD EMISSION GUN FIELD EMISSION GUN |
| Electron optics | Illumination mode: FLOOD BEAM / Imaging mode: BRIGHT FIELD / Nominal defocus max: 2.0 µm / Nominal defocus min: 1.0 µm |


