 Movie
Movie Controller

[English] 日本語
 Yorodumi
- EMDB-16485: Cryo-EM structure of the yeast SPT-Orm1-Dimer complex, local refi... -
+ Open data

- Basic information
| Entry |  | |||||||||
|---|---|---|---|---|---|---|---|---|---|---|
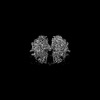
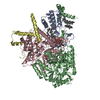
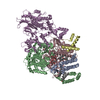
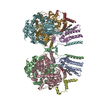
| Title | Cryo-EM structure of the yeast SPT-Orm1-Dimer complex, local refinement of a monomer | |||||||||
 Map data Map data | map-main | |||||||||
 Sample Sample |
| |||||||||
 Keywords Keywords | Serine-Palmitoyl-Transferase / SPT / Orm-Protein / TRANSFERASE | |||||||||
| Biological species |  | |||||||||
| Method | single particle reconstruction / cryo EM / Resolution: 3.0 Å | |||||||||
 Authors Authors | Schaefer J / Koerner C / Parey K / Januliene D / Moeller A / Froehlich F | |||||||||
| Funding support |  Germany, 2 items Germany, 2 items
| |||||||||
 Citation Citation | Journal: Nat Commun / Year: 2023 Title: Structure of the ceramide-bound SPOTS complex. Authors: Jan-Hannes Schäfer / Carolin Körner / Bianca M Esch / Sergej Limar / Kristian Parey / Stefan Walter / Dovile Januliene / Arne Moeller / Florian Fröhlich / Abstract: Sphingolipids are structural membrane components that also function in cellular stress responses. The serine palmitoyltransferase (SPT) catalyzes the rate-limiting step in sphingolipid biogenesis. ...Sphingolipids are structural membrane components that also function in cellular stress responses. The serine palmitoyltransferase (SPT) catalyzes the rate-limiting step in sphingolipid biogenesis. Its activity is tightly regulated through multiple binding partners, including Tsc3, Orm proteins, ceramides, and the phosphatidylinositol-4-phosphate (PI4P) phosphatase Sac1. The structural organization and regulatory mechanisms of this complex are not yet understood. Here, we report the high-resolution cryo-EM structures of the yeast SPT in complex with Tsc3 and Orm1 (SPOT) as dimers and monomers and a monomeric complex further carrying Sac1 (SPOTS). In all complexes, the tight interaction of the downstream metabolite ceramide and Orm1 reveals the ceramide-dependent inhibition. Additionally, observation of ceramide and ergosterol binding suggests a co-regulation of sphingolipid biogenesis and sterol metabolism within the SPOTS complex. | |||||||||
| History |
|
- Structure visualization
| Supplemental images |
|---|

- Downloads & links
-EMDB archive
| Map data | emd_16485.map.gz | 203.8 MB |  EMDB map data format EMDB map data format | |
|---|---|---|---|---|
| Header (meta data) | emd-16485-v30.xmlemd-16485.xml | 14.4 KB 14.4 KB | Display Display | EMDB header |
| FSC (resolution estimation) | emd_16485_fsc.xml | 12.7 KB | Display | FSC data file |
| Images | 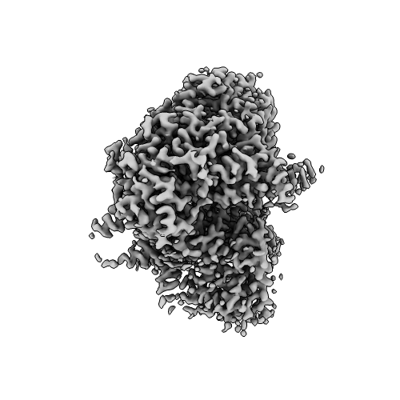 emd_16485.png emd_16485.png | 74 KB | ||
| Masks | emd_16485_msk_1.map | 216 MB | Mask map | |
| Filedesc metadata | emd-16485.cif.gz | 4.3 KB | ||
| Others | emd_16485_half_map_1.map.gzemd_16485_half_map_2.map.gz | 200.7 MB 200.7 MB | ||
| Archive directory |  http://ftp.pdbj.org/pub/emdb/structures/EMD-16485ftp://ftp.pdbj.org/pub/emdb/structures/EMD-16485 http://ftp.pdbj.org/pub/emdb/structures/EMD-16485ftp://ftp.pdbj.org/pub/emdb/structures/EMD-16485 | HTTPS FTP |
-Related structure data
-Links
| EMDB pages | EMDB (EBI/PDBe) / EMDataResource |
|---|
-Map
| File | Download / File: emd_16485.map.gz / Format: CCP4 / Size: 216 MB / Type: IMAGE STORED AS FLOATING POINT NUMBER (4 BYTES) | ||||||||||||||||||||||||||||||||||||
|---|---|---|---|---|---|---|---|---|---|---|---|---|---|---|---|---|---|---|---|---|---|---|---|---|---|---|---|---|---|---|---|---|---|---|---|---|---|
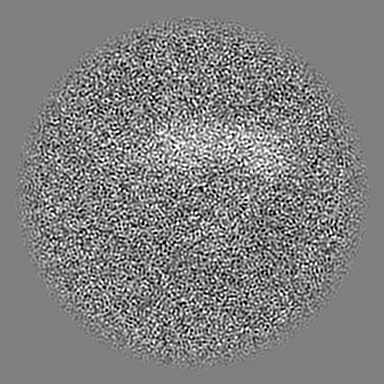
| Annotation | map-main | ||||||||||||||||||||||||||||||||||||
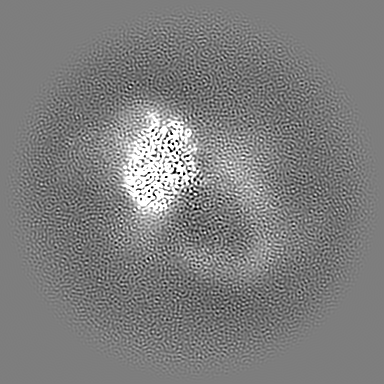
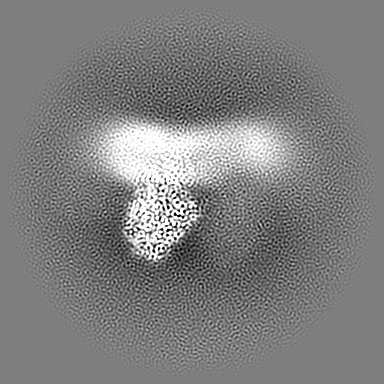
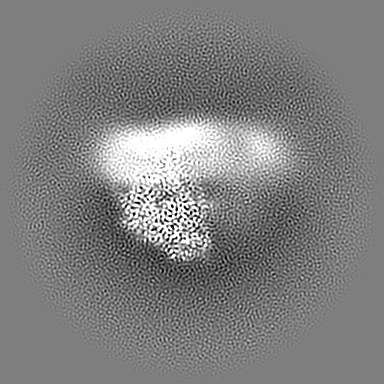
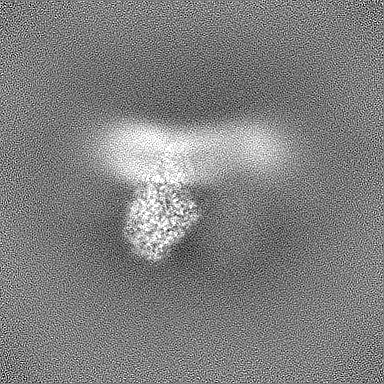
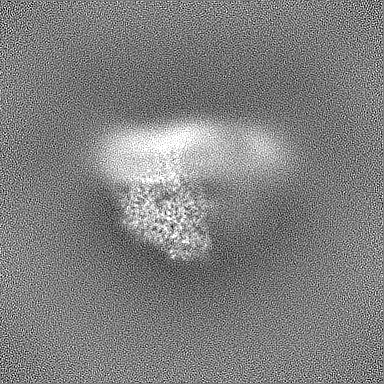
| Projections & slices | Image control
Images are generated by Spider. | ||||||||||||||||||||||||||||||||||||
| Voxel size | X=Y=Z: 0.924 Å | ||||||||||||||||||||||||||||||||||||
| Density |
| ||||||||||||||||||||||||||||||||||||
| Symmetry | Space group: 1 | ||||||||||||||||||||||||||||||||||||
| Details | EMDB XML:
|
 Z (Sec.)
 Y (Row.)
 X (Col.)


-Supplemental data
-Mask #1
| File | emd_16485_msk_1.map | ||||||||||||
|---|---|---|---|---|---|---|---|---|---|---|---|---|---|
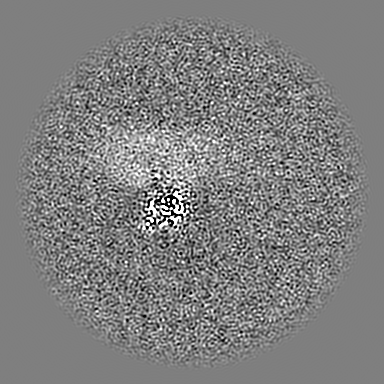
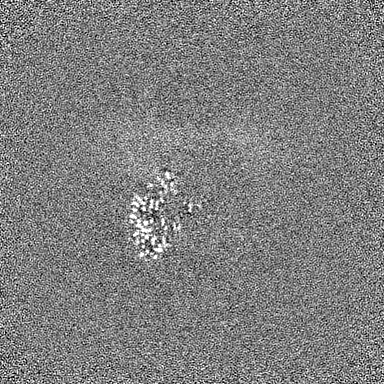
| Projections & Slices |
| ||||||||||||
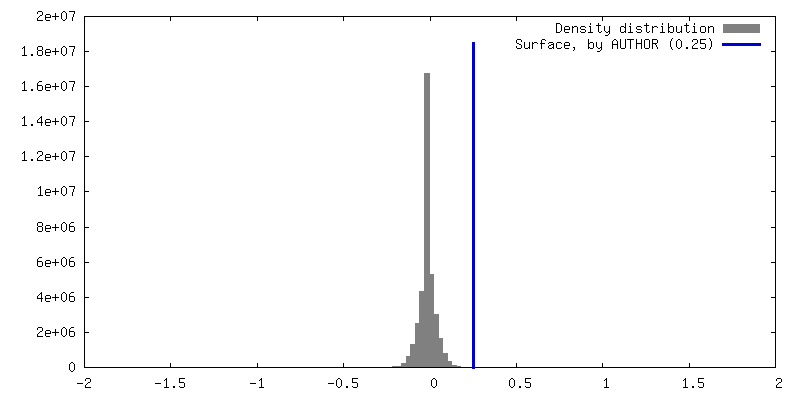
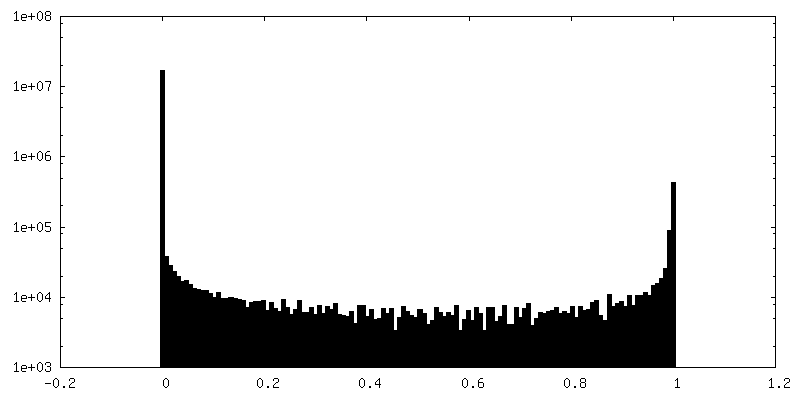
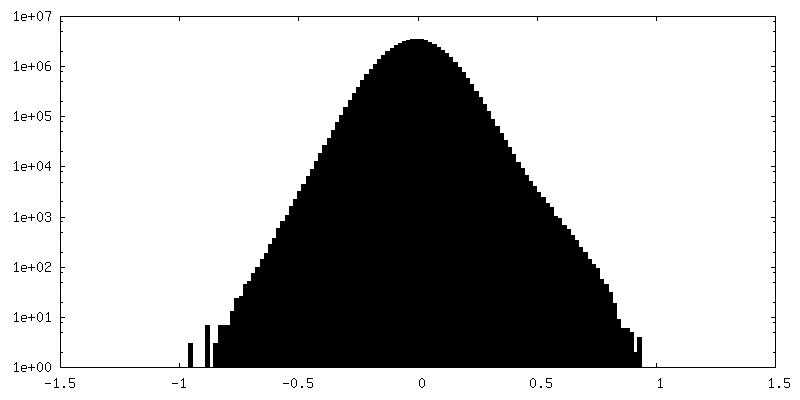
| Density Histograms |


-Half map: Dimer-Map-Masked-Half-A
| File | emd_16485_half_map_1.map | ||||||||||||
|---|---|---|---|---|---|---|---|---|---|---|---|---|---|
| Annotation | Dimer-Map-Masked-Half-A | ||||||||||||
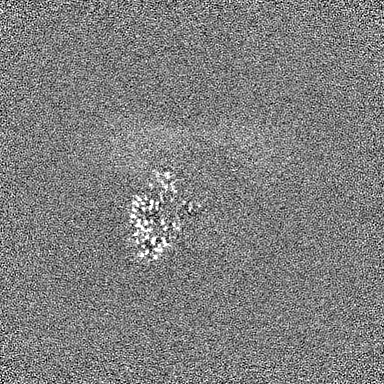
| Projections & Slices |
| ||||||||||||
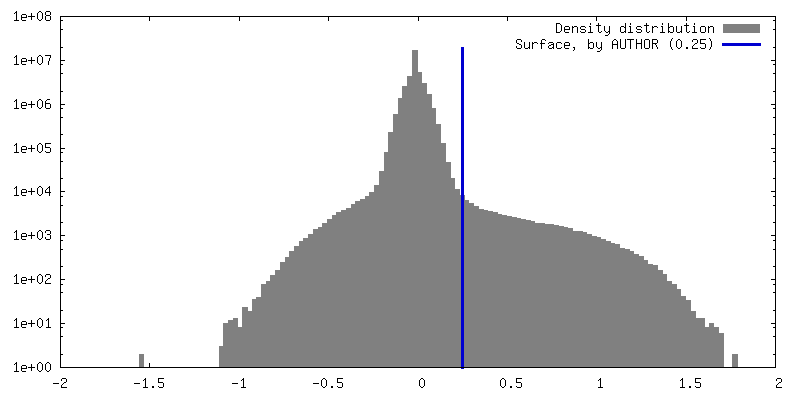
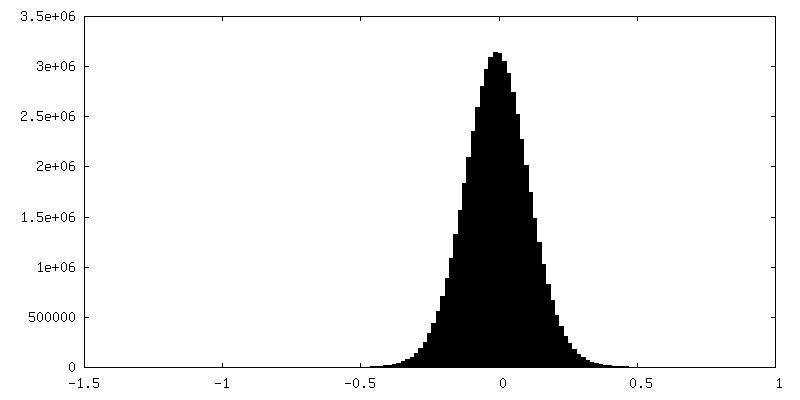
| Density Histograms |


-Half map: Dimer-Map-Masked-Half-B
| File | emd_16485_half_map_2.map | ||||||||||||
|---|---|---|---|---|---|---|---|---|---|---|---|---|---|
| Annotation | Dimer-Map-Masked-Half-B | ||||||||||||
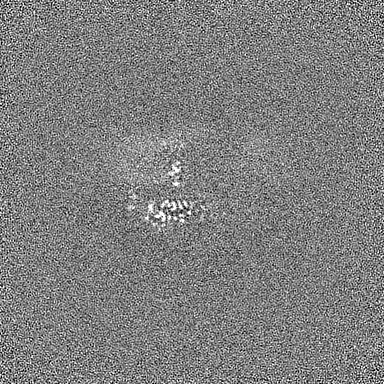
| Projections & Slices |
| ||||||||||||
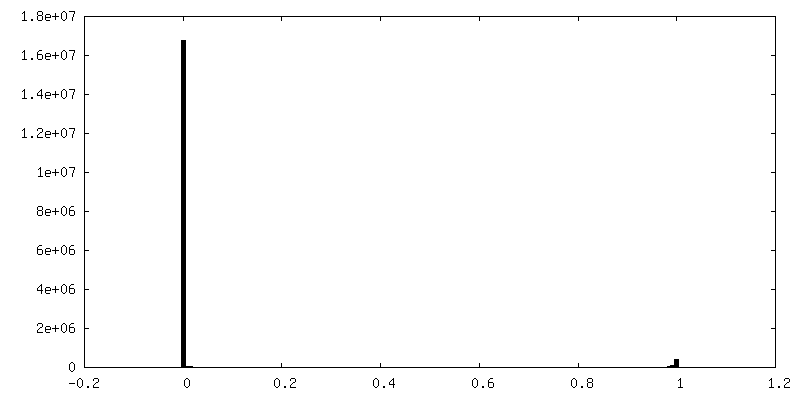
| Density Histograms |


- Sample components
-Entire : Heterotetrameric complex of Orm1 with Lcb1, Lcb2 and Tsc3
| Entire | Name: Heterotetrameric complex of Orm1 with Lcb1, Lcb2 and Tsc3 |
|---|---|
| Components |
|
-Supramolecule #1: Heterotetrameric complex of Orm1 with Lcb1, Lcb2 and Tsc3
| Supramolecule | Name: Heterotetrameric complex of Orm1 with Lcb1, Lcb2 and Tsc3 type: complex / ID: 1 / Parent: 0 |
|---|---|
| Source (natural) | Organism: |
| Molecular weight | Theoretical: 180 KDa |
-Experimental details
-Structure determination
| Method | cryo EM |
|---|---|
 Processing Processing | single particle reconstruction |
| Aggregation state | particle |
-Sample preparation
| Concentration | 10.0 mg/mL |
|---|---|
| Buffer | pH: 6.8 |
| Vitrification | Cryogen name: ETHANE / Chamber humidity: 100 % / Chamber temperature: 277.15 K / Instrument: FEI VITROBOT MARK IV |
- Electron microscopy
| Microscope | TFS GLACIOS |
|---|---|
| Specialist optics | Energy filter - Name: TFS Selectris / Energy filter - Slit width: 10 eV |
| Image recording | Film or detector model: FEI FALCON IV (4k x 4k) / Number real images: 13604 / Average electron dose: 50.0 e/Å2 |
| Electron beam | Acceleration voltage: 200 kV / Electron source:  FIELD EMISSION GUN FIELD EMISSION GUN |
| Electron optics | Illumination mode: FLOOD BEAM / Imaging mode: BRIGHT FIELD / Nominal defocus max: 2.0 µm / Nominal defocus min: 0.8 µm / Nominal magnification: 13000 |
+Image processing

-Atomic model buiding 1
| Refinement | Space: REAL / Protocol: AB INITIO MODEL / Overall B value: 86 |
|---|
