 Movie
Movie Controller

[English] 日本語
 Yorodumi
- EMDB-16250: Subtomogram average of a complex of IgG3-C1-C4b after focussed re... -
+ Open data

- Basic information
| Entry |  | ||||||||||||
|---|---|---|---|---|---|---|---|---|---|---|---|---|---|
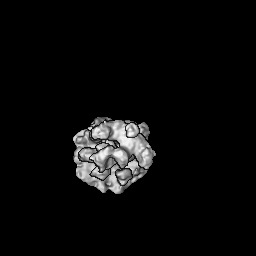
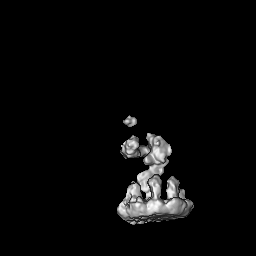
| Title | Subtomogram average of a complex of IgG3-C1-C4b after focussed refinement around the C4b region | ||||||||||||
 Map data Map data | Subtomogram average of a complex of IgG3-C1-C4b after focussed refinement around the C4b region | ||||||||||||
 Sample Sample |
| ||||||||||||
 Keywords Keywords | IgG3 / antibody / complement / C1 / C4b / IMMUNE SYSTEM | ||||||||||||
| Biological species |  Homo sapiens (human) Homo sapiens (human) | ||||||||||||
| Method | subtomogram averaging / cryo EM / Resolution: 30.0 Å | ||||||||||||
 Authors Authors | Abendstein L / Sharp TH | ||||||||||||
| Funding support | European Union,  Netherlands, 3 items Netherlands, 3 items
| ||||||||||||
 Citation Citation | Journal: Nat Commun / Year: 2023 Title: Complement is activated by elevated IgG3 hexameric platforms and deposits C4b onto distinct antibody domains. Authors: Leoni Abendstein / Douwe J Dijkstra / Rayman T N Tjokrodirijo / Peter A van Veelen / Leendert A Trouw / Paul J Hensbergen / Thomas H Sharp / Abstract: IgG3 is unique among the IgG subclasses due to its extended hinge, allotypic diversity and enhanced effector functions, including highly efficient pathogen neutralisation and complement activation. ...IgG3 is unique among the IgG subclasses due to its extended hinge, allotypic diversity and enhanced effector functions, including highly efficient pathogen neutralisation and complement activation. It is also underrepresented as an immunotherapeutic candidate, partly due to a lack of structural information. Here, we use cryoEM to solve structures of antigen-bound IgG3 alone and in complex with complement components. These structures reveal a propensity for IgG3-Fab clustering, which is possible due to the IgG3-specific flexible upper hinge region and may maximise pathogen neutralisation by forming high-density antibody arrays. IgG3 forms elevated hexameric Fc platforms that extend above the protein corona to maximise binding to receptors and the complement C1 complex, which here adopts a unique protease conformation that may precede C1 activation. Mass spectrometry reveals that C1 deposits C4b directly onto specific IgG3 residues proximal to the Fab domains. Structural analysis shows this to be caused by the height of the C1-IgG3 complex. Together, these data provide structural insights into the role of the unique IgG3 extended hinge, which will aid the development and design of upcoming immunotherapeutics based on IgG3. | ||||||||||||
| History |
|
- Structure visualization
| Supplemental images |
|---|

- Downloads & links
-EMDB archive
| Map data | emd_16250.map.gz | 56.7 MB |  EMDB map data format EMDB map data format | |
|---|---|---|---|---|
| Header (meta data) | emd-16250-v30.xmlemd-16250.xml | 14.4 KB 14.4 KB | Display Display | EMDB header |
| FSC (resolution estimation) | emd_16250_fsc.xml | 11.9 KB | Display | FSC data file |
| Images |  emd_16250.png emd_16250.png | 99.5 KB | ||
| Masks | emd_16250_msk_1.map | 64 MB | Mask map | |
| Others | emd_16250_half_map_1.map.gzemd_16250_half_map_2.map.gz | 56.3 MB 56.6 MB | ||
| Archive directory |  http://ftp.pdbj.org/pub/emdb/structures/EMD-16250ftp://ftp.pdbj.org/pub/emdb/structures/EMD-16250 http://ftp.pdbj.org/pub/emdb/structures/EMD-16250ftp://ftp.pdbj.org/pub/emdb/structures/EMD-16250 | HTTPS FTP |
-Related structure data


-Links
| EMDB pages | EMDB (EBI/PDBe) / EMDataResource |
|---|
-Map
| File | Download / File: emd_16250.map.gz / Format: CCP4 / Size: 64 MB / Type: IMAGE STORED AS FLOATING POINT NUMBER (4 BYTES) | ||||||||||||||||||||||||||||||||||||
|---|---|---|---|---|---|---|---|---|---|---|---|---|---|---|---|---|---|---|---|---|---|---|---|---|---|---|---|---|---|---|---|---|---|---|---|---|---|
| Annotation | Subtomogram average of a complex of IgG3-C1-C4b after focussed refinement around the C4b region | ||||||||||||||||||||||||||||||||||||
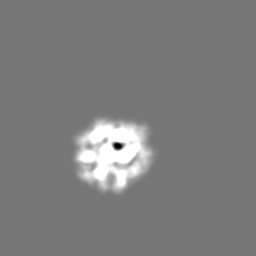
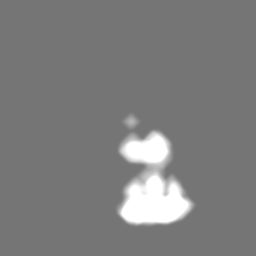
| Projections & slices | Image control
Images are generated by Spider. | ||||||||||||||||||||||||||||||||||||
| Voxel size | X=Y=Z: 3.48 Å | ||||||||||||||||||||||||||||||||||||
| Density |
| ||||||||||||||||||||||||||||||||||||
| Symmetry | Space group: 1 | ||||||||||||||||||||||||||||||||||||
| Details | EMDB XML:
|
 Z (Sec.)
 Y (Row.)
 X (Col.)


-Supplemental data
-Mask #1
| File | emd_16250_msk_1.map | ||||||||||||
|---|---|---|---|---|---|---|---|---|---|---|---|---|---|
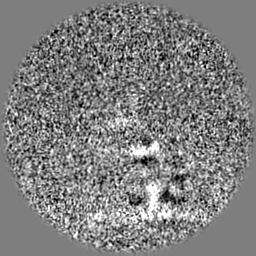
| Projections & Slices |
| ||||||||||||
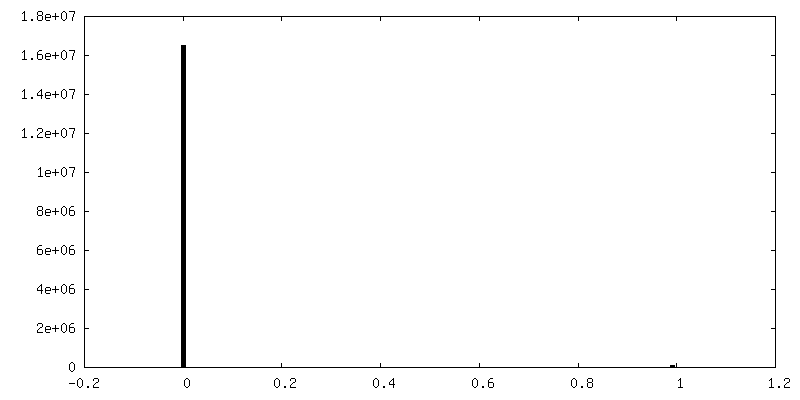
| Density Histograms |


-Half map: Half map of a subtomogram average of a...
| File | emd_16250_half_map_1.map | ||||||||||||
|---|---|---|---|---|---|---|---|---|---|---|---|---|---|
| Annotation | Half map of a subtomogram average of a complex of IgG3-C1-C4b after focussed refinement around the C4b region | ||||||||||||
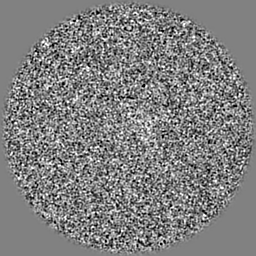
| Projections & Slices |
| ||||||||||||
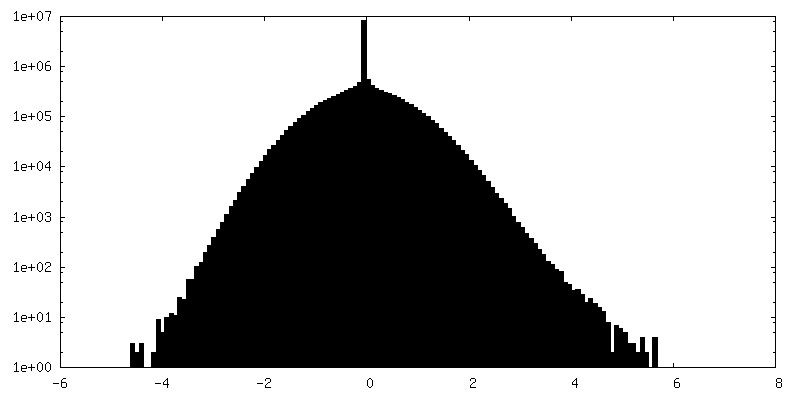
| Density Histograms |


-Half map: Half map of a subtomogram average of a...
| File | emd_16250_half_map_2.map | ||||||||||||
|---|---|---|---|---|---|---|---|---|---|---|---|---|---|
| Annotation | Half map of a subtomogram average of a complex of IgG3-C1-C4b after focussed refinement around the C4b region | ||||||||||||
| Projections & Slices |
| ||||||||||||
| Density Histograms |


- Sample components
-Entire : Complex of IgG3-C1-C4b after focussed refinement around the C4b region
| Entire | Name: Complex of IgG3-C1-C4b after focussed refinement around the C4b region |
|---|---|
| Components |
|
-Supramolecule #1: Complex of IgG3-C1-C4b after focussed refinement around the C4b region
| Supramolecule | Name: Complex of IgG3-C1-C4b after focussed refinement around the C4b region type: complex / ID: 1 / Parent: 0 / Macromolecule list: #1-#2 |
|---|---|
| Source (natural) | Organism: Homo sapiens (human) |
-Experimental details
-Structure determination
| Method | cryo EM |
|---|---|
 Processing Processing | subtomogram averaging |
| Aggregation state | particle |
-Sample preparation
| Buffer | pH: 7.4 / Details: PBS |
|---|---|
| Vitrification | Cryogen name: ETHANE |
- Electron microscopy
| Microscope | FEI TECNAI ARCTICA |
|---|---|
| Image recording | Film or detector model: GATAN K3 (6k x 4k) / Average electron dose: 1.5 e/Å2 |
| Electron beam | Acceleration voltage: 200 kV / Electron source:  FIELD EMISSION GUN FIELD EMISSION GUN |
| Electron optics | Illumination mode: FLOOD BEAM / Imaging mode: BRIGHT FIELD / Nominal defocus max: 6.0 µm / Nominal defocus min: 3.0 µm / Nominal magnification: 49000 |
| Experimental equipment |  Model: Talos Arctica / Image courtesy: FEI Company |

