 Movie
Movie Controller

[English] 日本語
 Yorodumi
- EMDB-14946: Map2 from paper entitled: Structure of a cholinergic cell membrane -
+ Open data

- Basic information
| Entry | 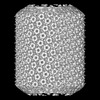 | |||||||||
|---|---|---|---|---|---|---|---|---|---|---|
| Title | Map2 from paper entitled: Structure of a cholinergic cell membrane | |||||||||
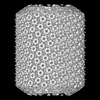
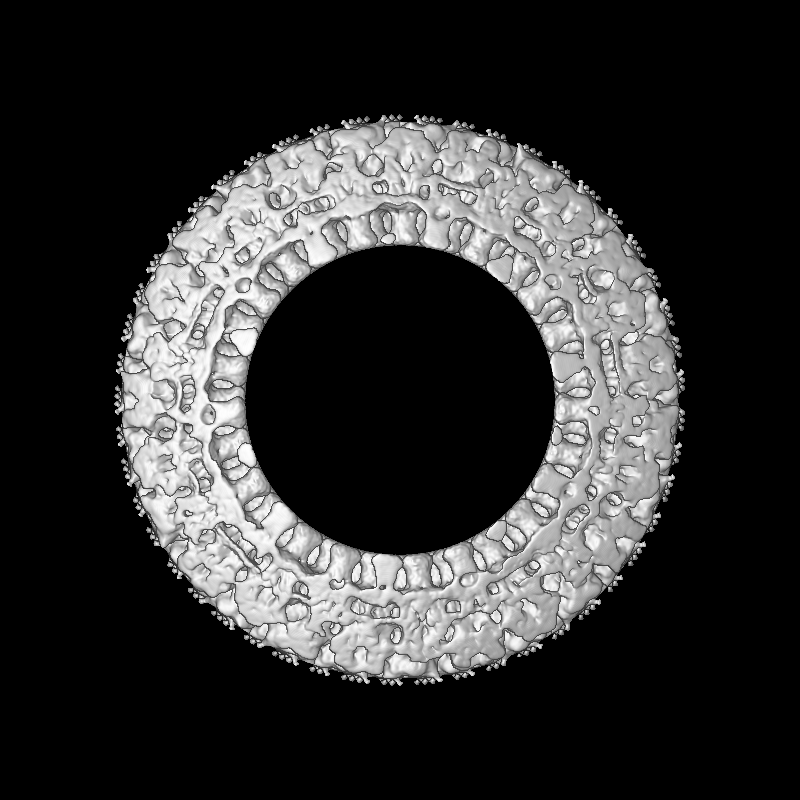
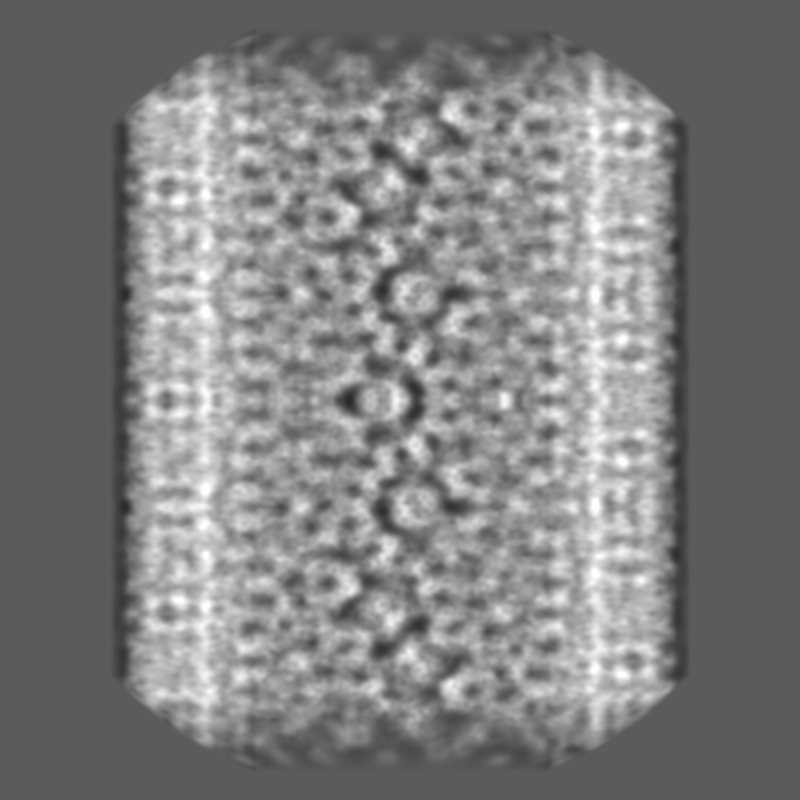
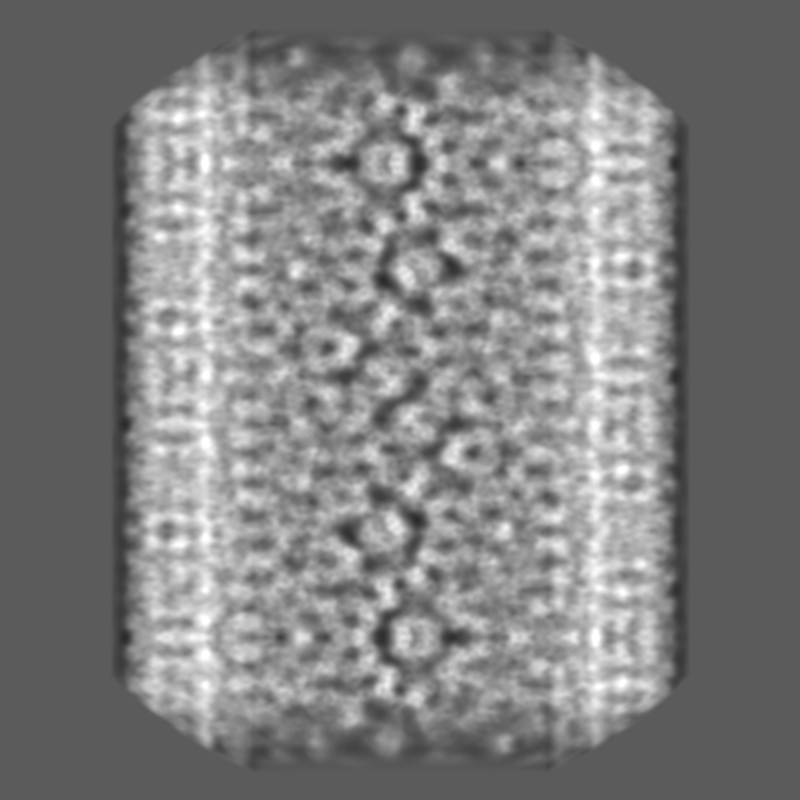
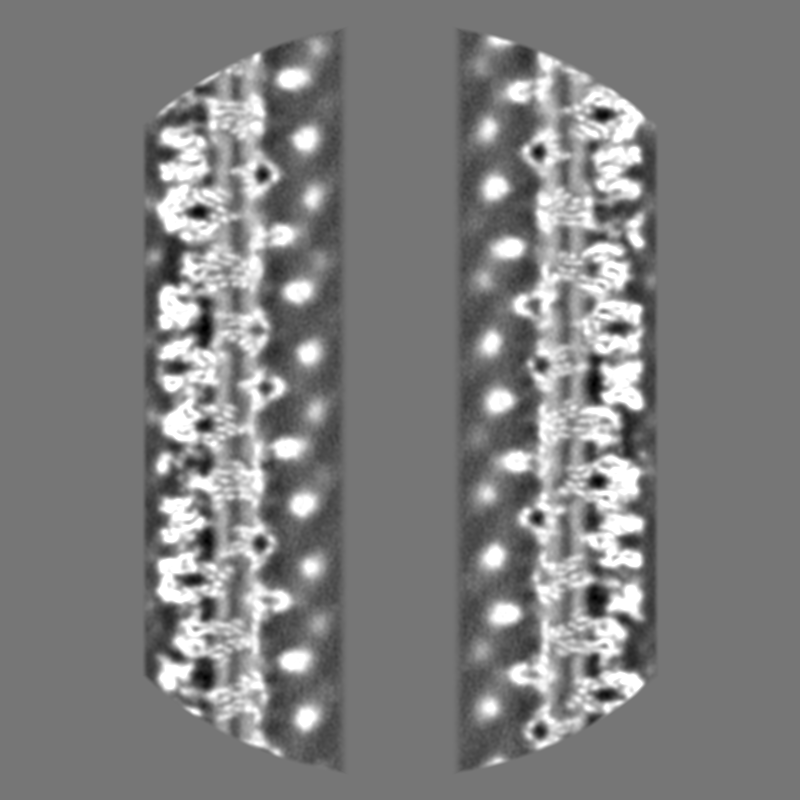
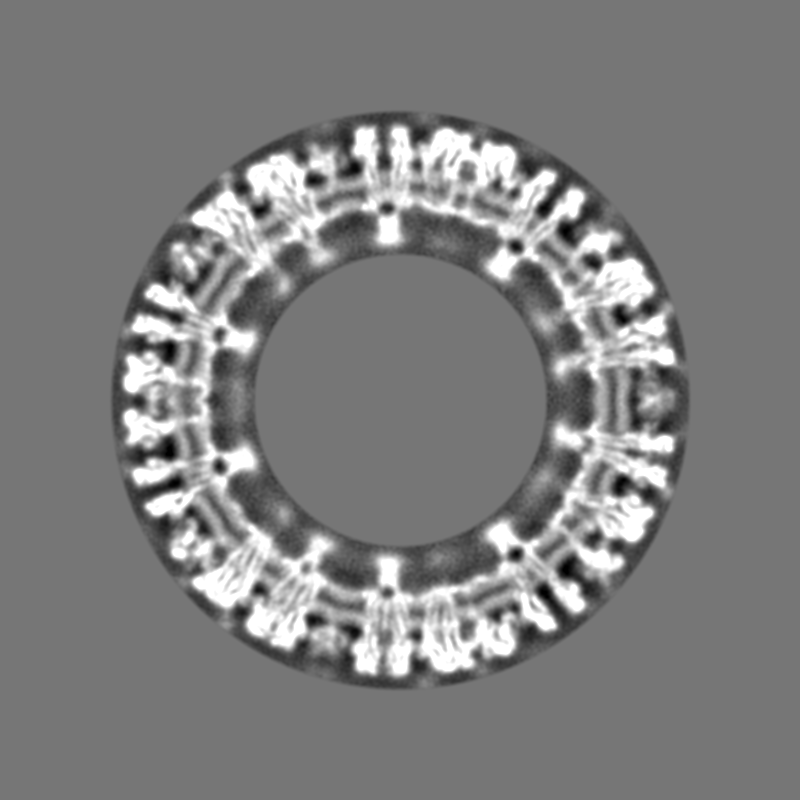
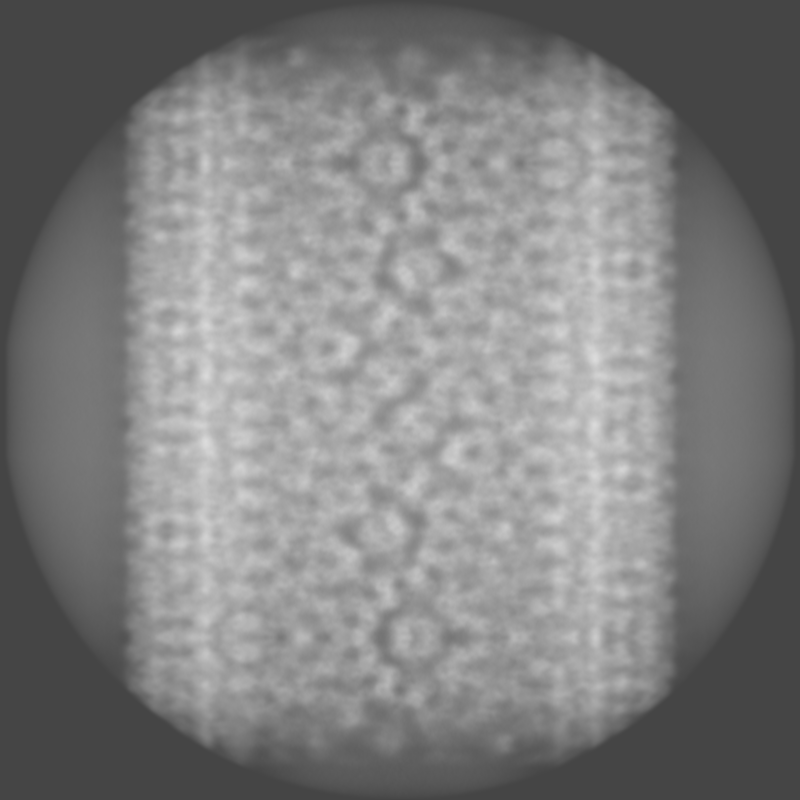
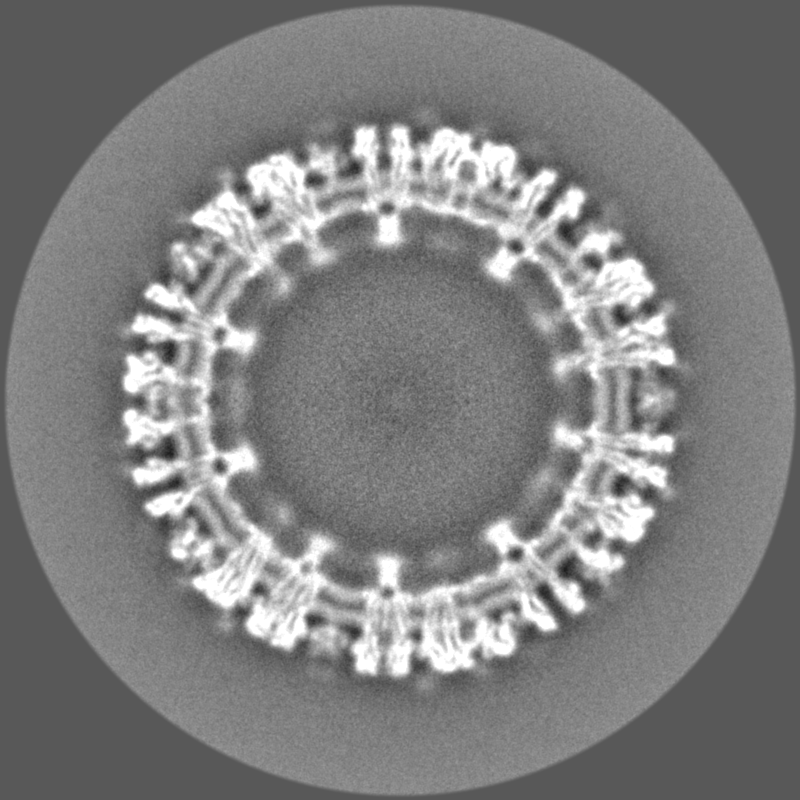
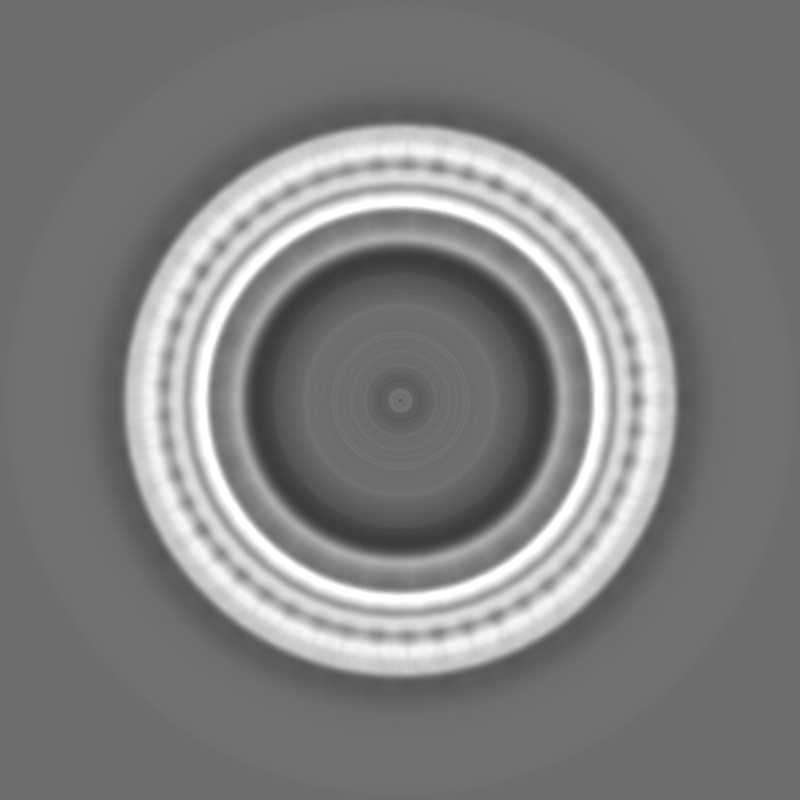
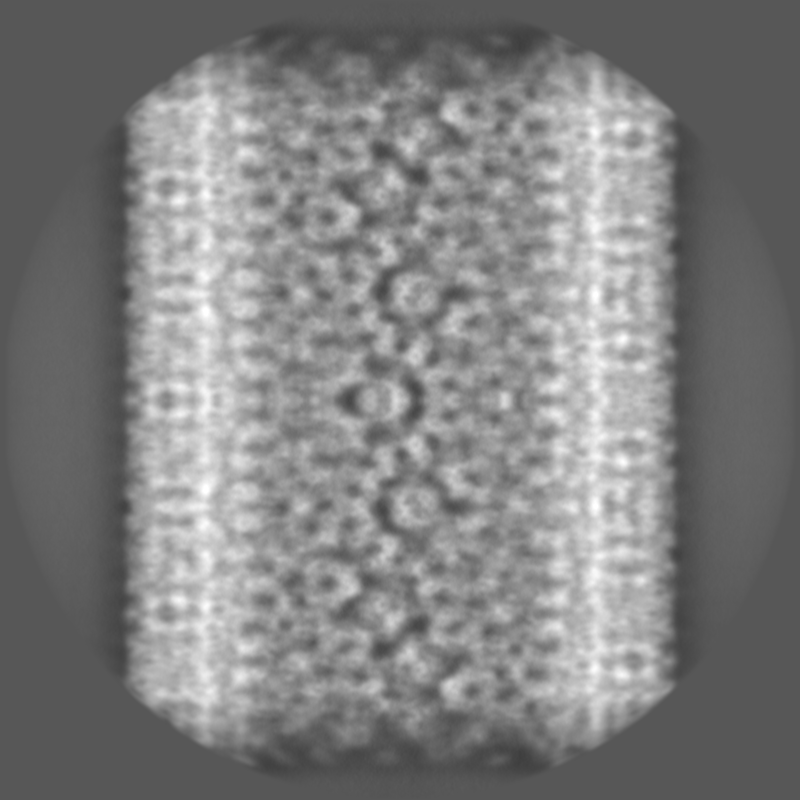
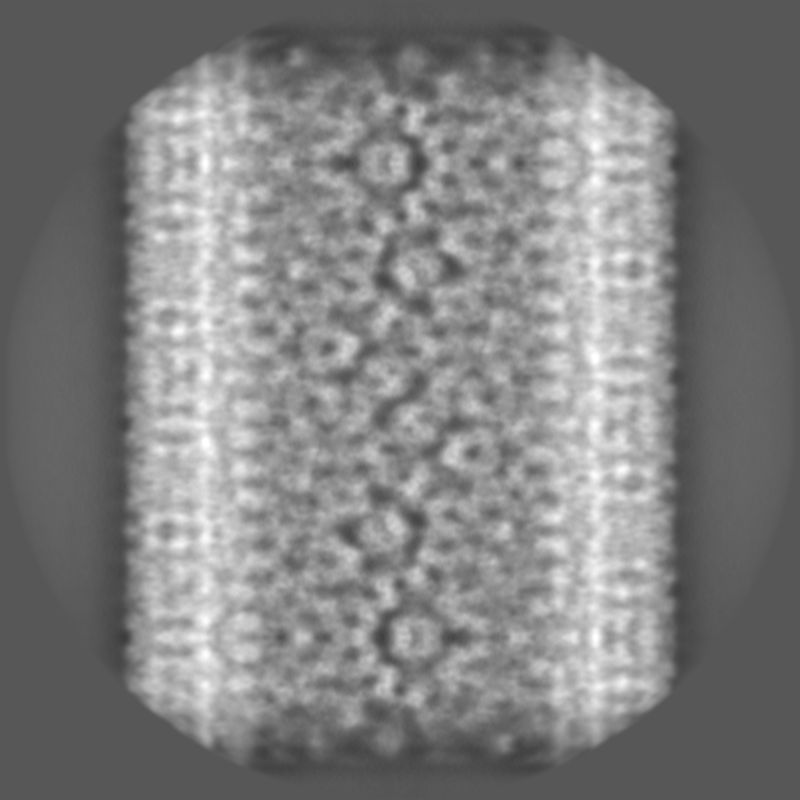
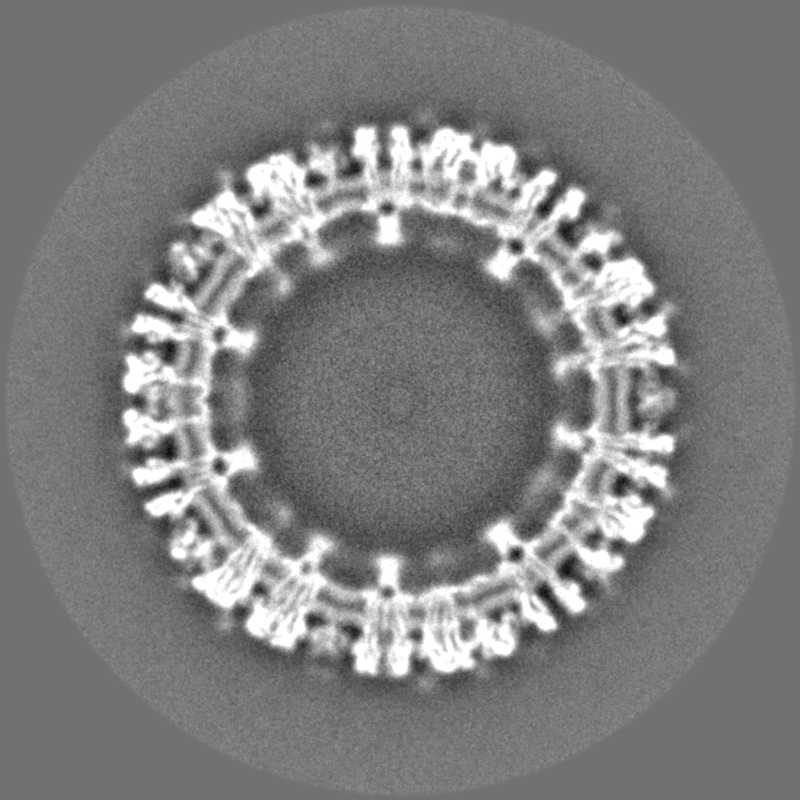
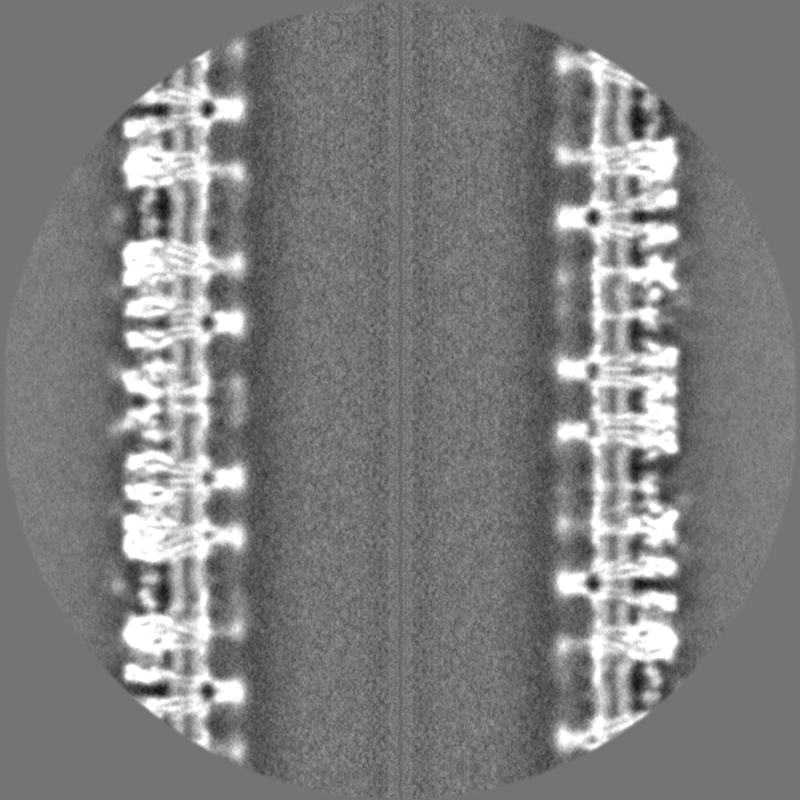
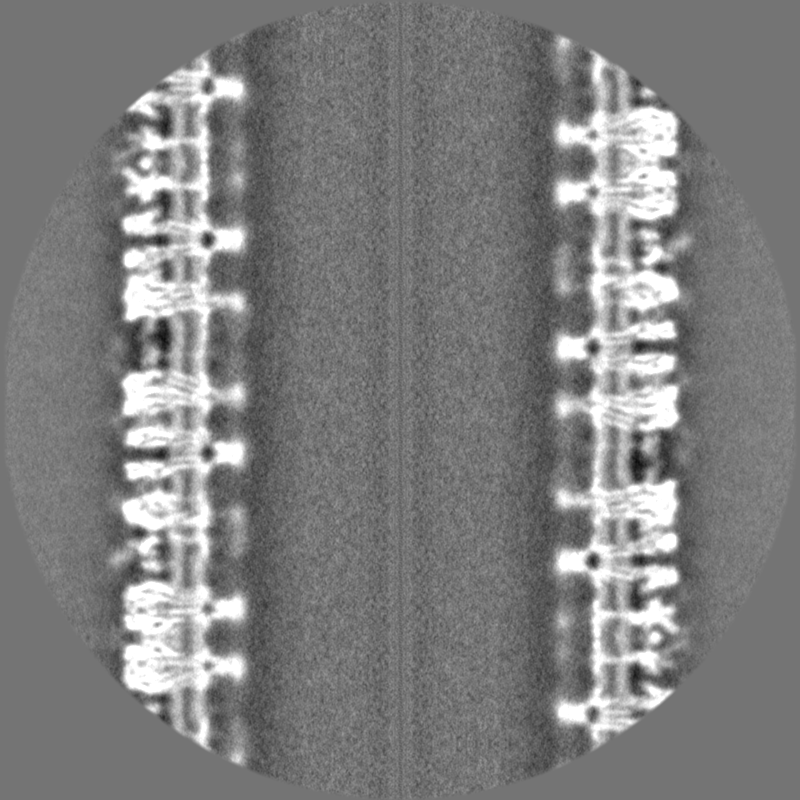
 Map data Map data | Density map of acetylcholine receptors in native lipid bilayer obtained by helical reconstruction of tubular vesicles from Torpedo | |||||||||
 Sample Sample |
| |||||||||
 Keywords Keywords | cholesterol / phospholipid / lipid bilayer / acetylcholine receptor / membrane protein | |||||||||
| Biological species |  | |||||||||
| Method | helical reconstruction / cryo EM / Resolution: 5.5 Å | |||||||||
 Authors Authors | Unwin N | |||||||||
| Funding support |  United Kingdom, 1 items United Kingdom, 1 items
| |||||||||
 Citation Citation | Journal: Proc Natl Acad Sci U S A / Year: 2022 Title: Structure of a cholinergic cell membrane. Authors: Nigel Unwin / Abstract: Cell membranes are complex assemblies of proteins and lipids making transient or long-term associations that have yet to be characterized at a molecular level. Here, cryo-electron microscopy is ...Cell membranes are complex assemblies of proteins and lipids making transient or long-term associations that have yet to be characterized at a molecular level. Here, cryo-electron microscopy is applied to determine how phospholipids and cholesterol arrange between neighboring proteins (nicotinic acetylcholine receptors) of cholinergic membrane. The lipids exhibit distinct properties in the two leaflets of the bilayer, influenced by the protein surfaces and by differences in cholesterol concentration. In the outer leaflet, the lipids show no consistent motif away from the protein surfaces, in keeping with their assumed fluidity. In the inner leaflet, where the cholesterol concentration is higher, the lipids organize into extensive close-packed linear arrays. These arrays are built from the sterol groups of cholesterol and the initial saturated portions of the phospholipid hydrocarbon chains. Together, they create an ordered ∼7 Å-thick "skin" within the hydrophobic core of the bilayer. The packing of lipids in the arrays appears to bear a close relationship to the linear cholesterol arrays that form crystalline monolayers at the air-water interface. | |||||||||
| History |
|
- Structure visualization
| Supplemental images |
|---|

- Downloads & links
-EMDB archive
| Map data | emd_14946.map.gz | 475.2 MB |  EMDB map data format EMDB map data format | |
|---|---|---|---|---|
| Header (meta data) | emd-14946-v30.xmlemd-14946.xml | 17.1 KB 17.1 KB | Display Display | EMDB header |
| Images | 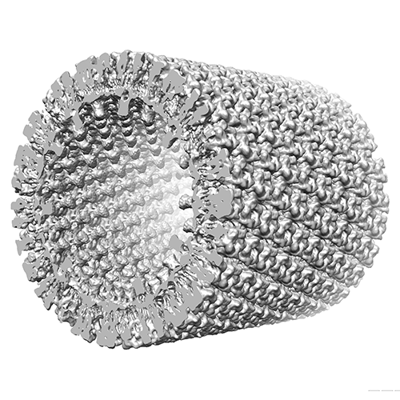 emd_14946.png emd_14946.png | 162.8 KB | ||
| Filedesc metadata | emd-14946.cif.gz | 4.9 KB | ||
| Others | emd_14946_half_map_1.map.gzemd_14946_half_map_2.map.gz | 925.5 MB 965.3 MB | ||
| Archive directory |  http://ftp.pdbj.org/pub/emdb/structures/EMD-14946ftp://ftp.pdbj.org/pub/emdb/structures/EMD-14946 http://ftp.pdbj.org/pub/emdb/structures/EMD-14946ftp://ftp.pdbj.org/pub/emdb/structures/EMD-14946 | HTTPS FTP |
-Related structure data
-Links
| EMDB pages | EMDB (EBI/PDBe) / EMDataResource |
|---|
-Map
| File | Download / File: emd_14946.map.gz / Format: CCP4 / Size: 1.9 GB / Type: IMAGE STORED AS FLOATING POINT NUMBER (4 BYTES) | ||||||||||||||||||||||||||||||||||||
|---|---|---|---|---|---|---|---|---|---|---|---|---|---|---|---|---|---|---|---|---|---|---|---|---|---|---|---|---|---|---|---|---|---|---|---|---|---|
| Annotation | Density map of acetylcholine receptors in native lipid bilayer obtained by helical reconstruction of tubular vesicles from Torpedo | ||||||||||||||||||||||||||||||||||||
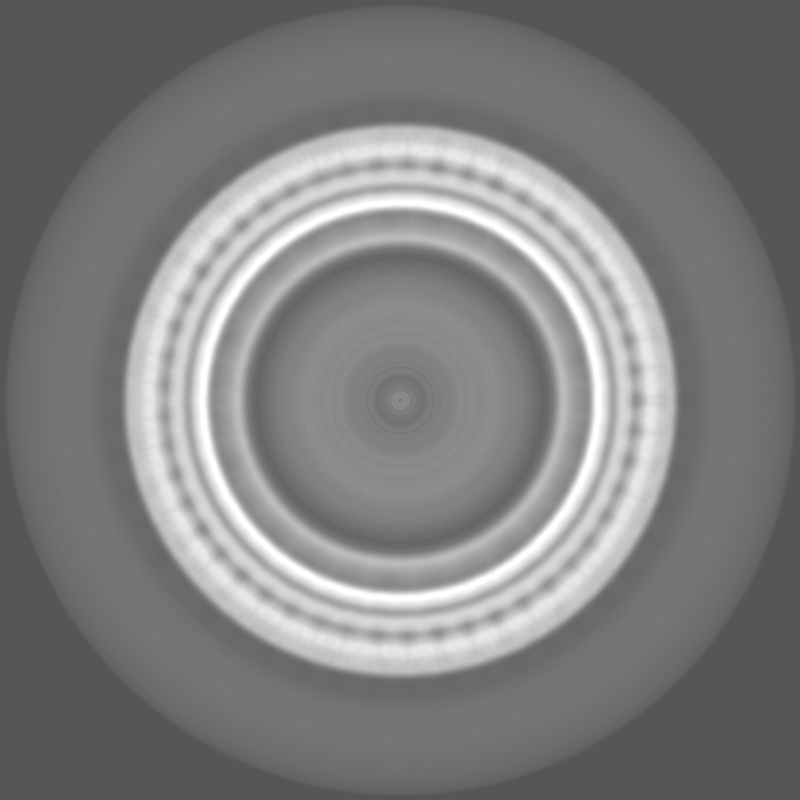
| Projections & slices | Image control
Images are generated by Spider. | ||||||||||||||||||||||||||||||||||||
| Voxel size | X=Y=Z: 1.34 Å | ||||||||||||||||||||||||||||||||||||
| Density |
| ||||||||||||||||||||||||||||||||||||
| Symmetry | Space group: 1 | ||||||||||||||||||||||||||||||||||||
| Details | EMDB XML:
|
 Z (Sec.)
 Y (Row.)
 X (Col.)


-Supplemental data
-Half map: First half-map
| File | emd_14946_half_map_1.map | ||||||||||||
|---|---|---|---|---|---|---|---|---|---|---|---|---|---|
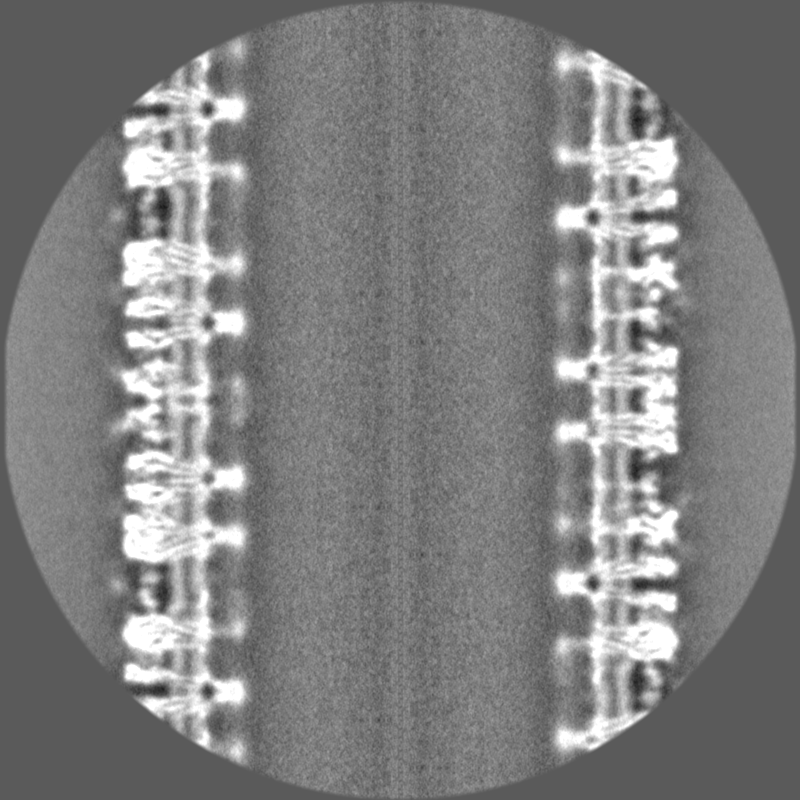
| Annotation | First half-map | ||||||||||||
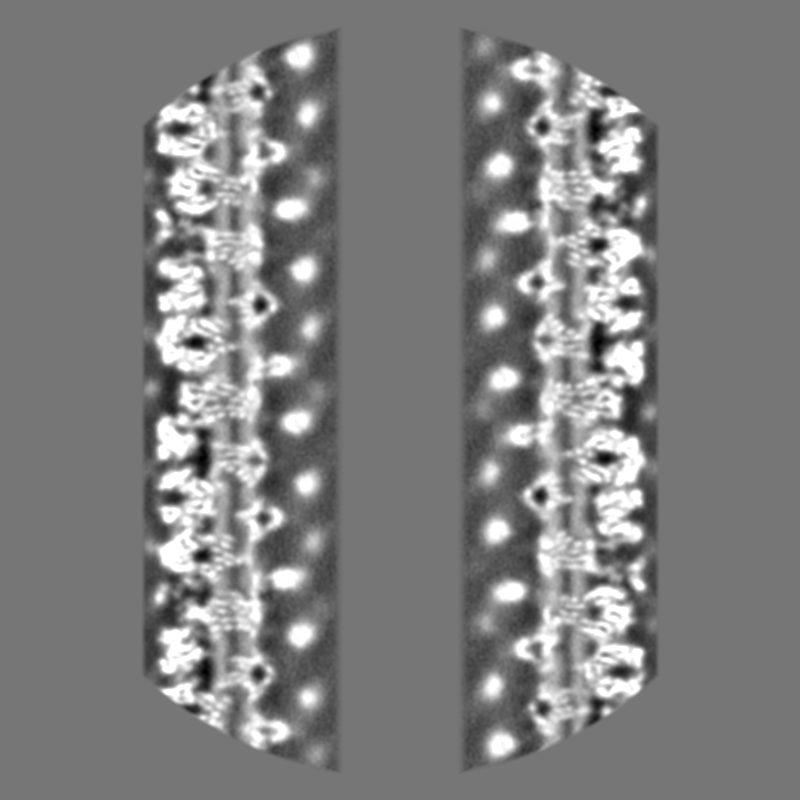
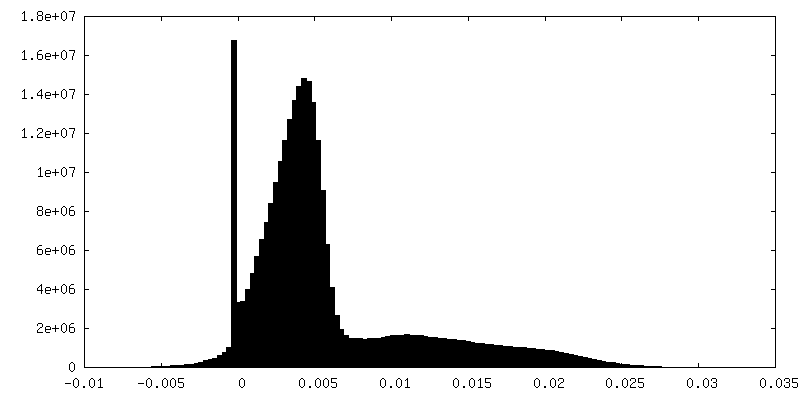
| Projections & Slices |
| ||||||||||||
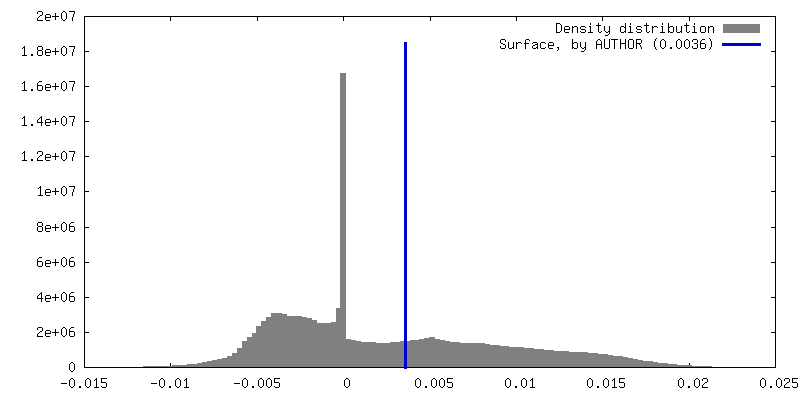
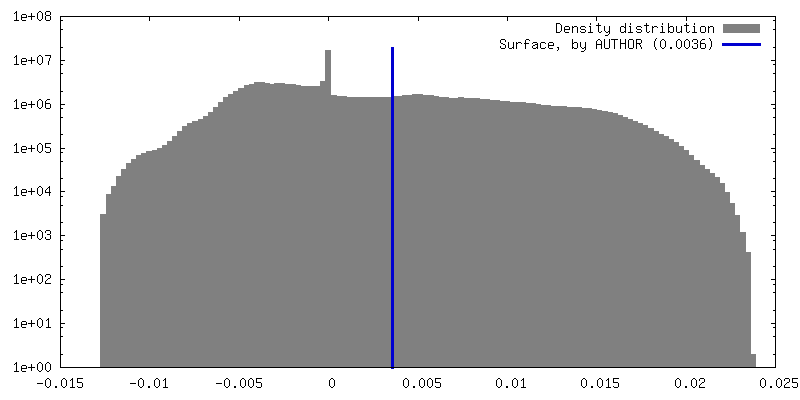
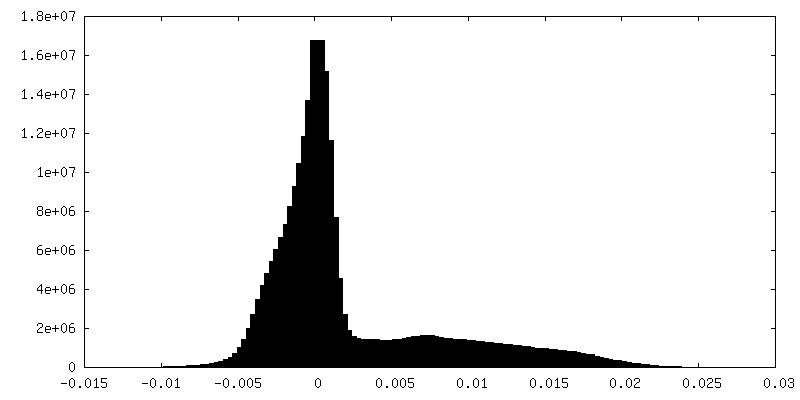
| Density Histograms |

-Half map: Second half-map
| File | emd_14946_half_map_2.map | ||||||||||||
|---|---|---|---|---|---|---|---|---|---|---|---|---|---|
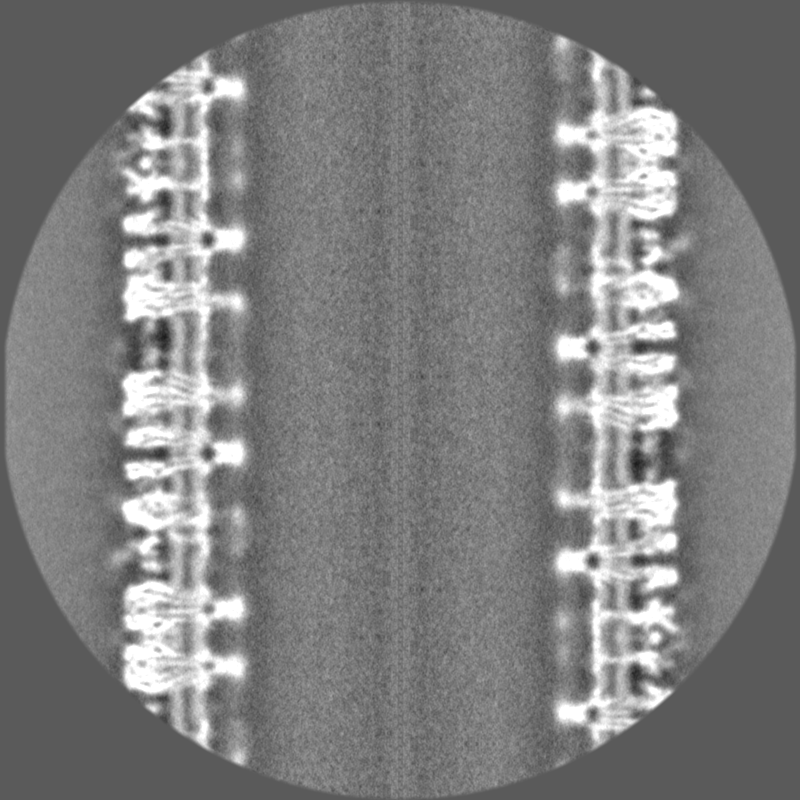
| Annotation | Second half-map | ||||||||||||
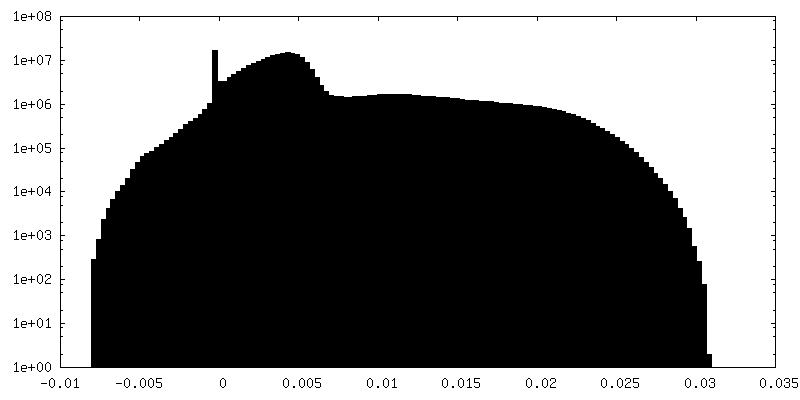
| Projections & Slices |
| ||||||||||||
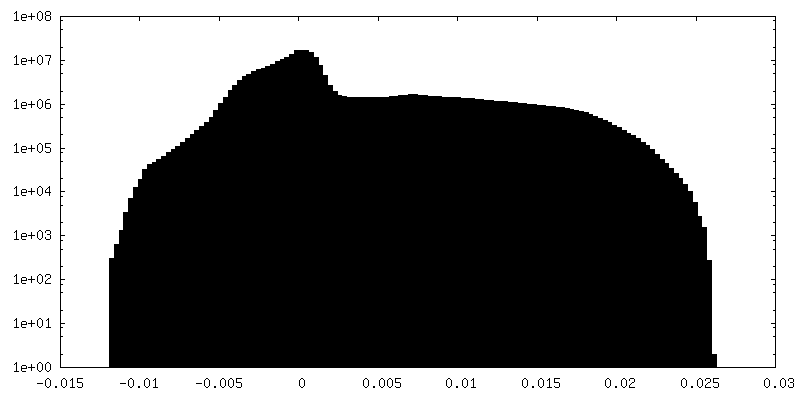
| Density Histograms |
- Sample components
-Entire : Cholinergic cell membrane
| Entire | Name: Cholinergic cell membrane |
|---|---|
| Components |
|
-Supramolecule #1: Cholinergic cell membrane
| Supramolecule | Name: Cholinergic cell membrane / type: organelle_or_cellular_component / ID: 1 / Parent: 0 / Macromolecule list: #1 Details: Tubular vesicles obtained from acetycholine receptor-rich cell membranes, isolated from Torpedo electric organ |
|---|---|
| Source (natural) | Organism: |
-Experimental details
-Structure determination
| Method | cryo EM |
|---|---|
 Processing Processing | helical reconstruction |
| Aggregation state | helical array |
-Sample preparation
| Buffer | pH: 7 / Component - Concentration: 100.0 mM / Component - Formula: C2H6AsNaO2 / Component - Name: sodium cacodylate |
|---|---|
| Grid | Model: Quantifoil R1.2/1.3 / Material: COPPER / Mesh: 300 / Support film - Material: CARBON / Support film - topology: HOLEY ARRAY / Support film - Film thickness: 20 / Pretreatment - Type: GLOW DISCHARGE / Pretreatment - Time: 60 sec. / Pretreatment - Atmosphere: OTHER |
| Vitrification | Cryogen name: ETHANE / Chamber humidity: 95 % / Chamber temperature: 283 K / Instrument: HOMEMADE PLUNGER Details: blot until filter paper loses water-contact to grid surface (~5 secs).. |
| Details | The tubular vesicles are comprised of nicotinic acetylcholine receptors in a cholesterol-rich phospholipid bilayer. |
- Electron microscopy
| Microscope | FEI TITAN KRIOS |
|---|---|
| Temperature | Min: 90.0 K / Max: 90.0 K |
| Image recording | Film or detector model: FEI FALCON III (4k x 4k) / Detector mode: INTEGRATING / Digitization - Dimensions - Width: 4096 pixel / Digitization - Dimensions - Height: 4096 pixel / Number grids imaged: 160 / Number real images: 1993 / Average exposure time: 2.0 sec. / Average electron dose: 40.0 e/Å2 Details: Images were collected in movie mode at 40 frames per second |
| Electron beam | Acceleration voltage: 300 kV / Electron source:  FIELD EMISSION GUN FIELD EMISSION GUN |
| Electron optics | C2 aperture diameter: 50.0 µm / Calibrated defocus max: 2.8000000000000003 µm / Calibrated defocus min: 1.4000000000000001 µm / Illumination mode: FLOOD BEAM / Imaging mode: BRIGHT FIELD / Cs: 2.7 mm / Nominal defocus max: 2.8000000000000003 µm / Nominal defocus min: 1.4000000000000001 µm / Nominal magnification: 59000 |
| Sample stage | Specimen holder model: FEI TITAN KRIOS AUTOGRID HOLDER / Cooling holder cryogen: NITROGEN |
| Experimental equipment |  Model: Titan Krios / Image courtesy: FEI Company |
