 Movie
Movie Controller


+ Open data

- Basic information
| Entry | Database: EMDB / ID: EMD-6314 | |||||||||
|---|---|---|---|---|---|---|---|---|---|---|
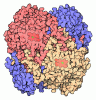
| Title | Catalase solved at 3.2 Angstrom resolution by MicroED | |||||||||
 Map data Map data | Catalase diffraction data phased by molecular replacement | |||||||||
 Sample Sample |
| |||||||||
 Keywords Keywords | catalase / microcrystal | |||||||||
| Function / homology |  Function and homology information Function and homology informationcatalase complex / Detoxification of Reactive Oxygen Species / Peroxisomal protein import / cellular detoxification of hydrogen peroxide / catalase / catalase activity / Neutrophil degranulation / peroxisomal matrix / positive regulation of cell division / hydrogen peroxide catabolic process ...catalase complex / Detoxification of Reactive Oxygen Species / Peroxisomal protein import / cellular detoxification of hydrogen peroxide / catalase / catalase activity / Neutrophil degranulation / peroxisomal matrix / positive regulation of cell division / hydrogen peroxide catabolic process / response to hydrogen peroxide / peroxisome / heme binding / enzyme binding / mitochondrion / metal ion binding / cytoplasm Similarity search - Function | |||||||||
| Biological species |  | |||||||||
| Method | electron crystallography / cryo EM / Resolution: 3.2 Å | |||||||||
 Authors Authors | Nannenga BL / Shi D / Hattne J / Reyes FE / Gonen T | |||||||||
 Citation Citation | Journal: Elife / Year: 2014 Title: Structure of catalase determined by MicroED. Authors: Brent L Nannenga / Dan Shi / Johan Hattne / Francis E Reyes / Tamir Gonen /  Abstract: MicroED is a recently developed method that uses electron diffraction for structure determination from very small three-dimensional crystals of biological material. Previously we used a series of ...MicroED is a recently developed method that uses electron diffraction for structure determination from very small three-dimensional crystals of biological material. Previously we used a series of still diffraction patterns to determine the structure of lysozyme at 2.9 Å resolution with MicroED (Shi et al., 2013). Here we present the structure of bovine liver catalase determined from a single crystal at 3.2 Å resolution by MicroED. The data were collected by continuous rotation of the sample under constant exposure and were processed and refined using standard programs for X-ray crystallography. The ability of MicroED to determine the structure of bovine liver catalase, a protein that has long resisted atomic analysis by traditional electron crystallography, demonstrates the potential of this method for structure determination. | |||||||||
| History |
|
- Structure visualization
| Movie |
Movie viewer |
|---|---|
| Structure viewer | EM map: SurfViewMolmilJmol/JSmol |
| Supplemental images |
- Downloads & links
-EMDB archive
| Map data | emd_6314.map.gz | 16.5 MB | EMDB map data format | |
|---|---|---|---|---|
| Header (meta data) | emd-6314-v30.xmlemd-6314.xml | 9.9 KB 9.9 KB | Display Display | EMDB header |
| Images |  400_6314.gif 400_6314.gif 80_6314.gif 80_6314.gif | 105.4 KB 5.9 KB | ||
| Archive directory |  http://ftp.pdbj.org/pub/emdb/structures/EMD-6314ftp://ftp.pdbj.org/pub/emdb/structures/EMD-6314 http://ftp.pdbj.org/pub/emdb/structures/EMD-6314ftp://ftp.pdbj.org/pub/emdb/structures/EMD-6314 | HTTPS FTP |
-Related structure data
| Related structure data |  3j7bMC M: atomic model generated by this map C: citing same article ( |
|---|---|
| Similar structure data |
-Links
| EMDB pages | EMDB (EBI/PDBe) / EMDataResource |
|---|---|
| Related items in Molecule of the Month |
-Map
| File | Download / File: emd_6314.map.gz / Format: CCP4 / Size: 17.4 MB / Type: IMAGE STORED AS FLOATING POINT NUMBER (4 BYTES) | ||||||||||||||||||||||||||||||||||||||||||||||||||||||||||||||||||||
|---|---|---|---|---|---|---|---|---|---|---|---|---|---|---|---|---|---|---|---|---|---|---|---|---|---|---|---|---|---|---|---|---|---|---|---|---|---|---|---|---|---|---|---|---|---|---|---|---|---|---|---|---|---|---|---|---|---|---|---|---|---|---|---|---|---|---|---|---|---|
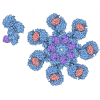
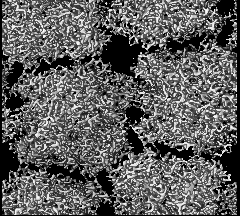
| Annotation | Catalase diffraction data phased by molecular replacement | ||||||||||||||||||||||||||||||||||||||||||||||||||||||||||||||||||||
| Projections & slices | Image control
Images are generated by Spider. generated in cubic-lattice coordinate | ||||||||||||||||||||||||||||||||||||||||||||||||||||||||||||||||||||
| Voxel size | X: 0.75156 Å / Y: 0.79667 Å / Z: 0.75863 Å | ||||||||||||||||||||||||||||||||||||||||||||||||||||||||||||||||||||
| Density |
| ||||||||||||||||||||||||||||||||||||||||||||||||||||||||||||||||||||
| Symmetry | Space group: 19 | ||||||||||||||||||||||||||||||||||||||||||||||||||||||||||||||||||||
| Details | EMDB XML:
CCP4 map header:
| ||||||||||||||||||||||||||||||||||||||||||||||||||||||||||||||||||||
 X (Sec.)
 Y (Row.)
 Z (Col.)


-Supplemental data
- Sample components
-Entire : catalase
| Entire | Name: catalase |
|---|---|
| Components |
|
-Supramolecule #1000: catalase
| Supramolecule | Name: catalase / type: sample / ID: 1000 / Details: catalase microcrystals / Oligomeric state: tetramer / Number unique components: 1 |
|---|---|
| Molecular weight | Theoretical: 240 KDa |
-Macromolecule #1: catalase
| Macromolecule | Name: catalase / type: protein_or_peptide / ID: 1 / Details: catalase microcrystals / Oligomeric state: tetramer / Recombinant expression: No / Database: NCBI |
|---|---|
| Source (natural) | Organism: |
| Molecular weight | Theoretical: 240 KDa |
| Sequence | UniProtKB: Catalase |
-Experimental details
-Structure determination
| Method | cryo EM |
|---|---|
 Processing Processing | electron crystallography |
| Aggregation state | 3D array |
-Sample preparation
| Buffer | pH: 6.3 / Details: 50 mM sodium phosphate |
|---|---|
| Grid | Details: 300 mesh copper grid with holey carbon support |
| Vitrification | Cryogen name: ETHANE / Chamber temperature: 100 K / Instrument: FEI VITROBOT MARK IV Method: Crystals were added to the grid for 30 seconds and then blotted for 2 to 6 seconds. |
| Details | Catalase containing 10% sodium chloride was dialyzed overnight in 50 mM sodium phosphate to remove the sodium chloride. Crystals formed following dialysis. |
| Crystal formation | Details: Catalase containing 10% sodium chloride was dialyzed overnight in 50 mM sodium phosphate to remove the sodium chloride. Crystals formed following dialysis. |
- Electron microscopy
| Microscope | FEI TECNAI F20 |
|---|---|
| Temperature | Min: 90 K / Max: 110 K / Average: 100 K |
| Date | Jun 15, 2014 |
| Image recording | Category: CCD / Film or detector model: TVIPS TEMCAM-F416 (4k x 4k) / Average electron dose: 0.1 e/Å2 / Camera length: 2000 Details: Raw diffraction images are available upon request. Contact the Gonen lab for access. |
| Electron beam | Acceleration voltage: 200 kV / Electron source:  FIELD EMISSION GUN FIELD EMISSION GUN |
| Electron optics | Illumination mode: OTHER / Imaging mode: DIFFRACTION |
| Sample stage | Specimen holder model: GATAN LIQUID NITROGEN / Tilt angle min: -55 / Tilt angle max: 55 / Tilt series - Axis1 - Min angle: -55 ° / Tilt series - Axis1 - Max angle: 55 ° |
| Experimental equipment | 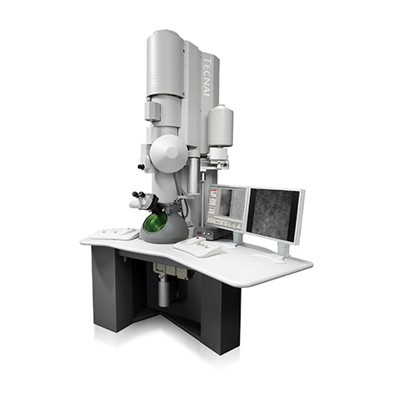 Model: Tecnai F20 / Image courtesy: FEI Company |
-Image processing
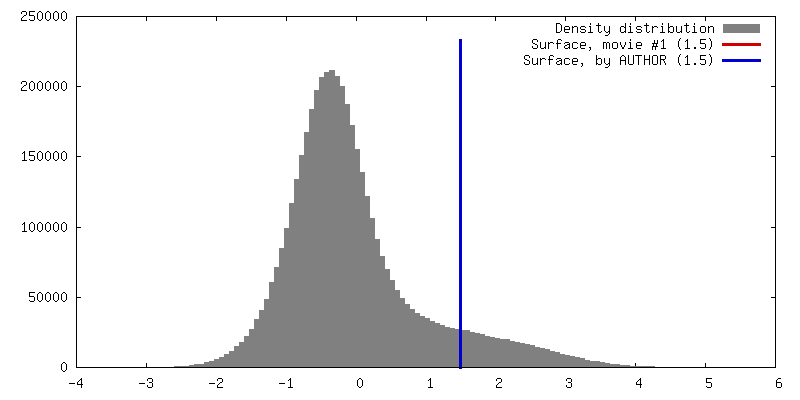
| Final reconstruction | Resolution.type: BY AUTHOR / Resolution: 3.2 Å / Resolution method: DIFFRACTION PATTERN/LAYERLINES |
|---|---|
| Crystal parameters | Unit cell - A: 67.84 Å / Unit cell - B: 172.08 Å / Unit cell - C: 182.070 Å / Unit cell - γ: 90 ° / Unit cell - α: 90 ° / Unit cell - β: 90 ° / Space group: P 21 21 21 |
