 Movie
Movie Controller


+ Open data

- Basic information
| Entry |  | |||||||||
|---|---|---|---|---|---|---|---|---|---|---|
| Title | Cryo-Electron Tomography of Cultured Neuronal Synapses | |||||||||
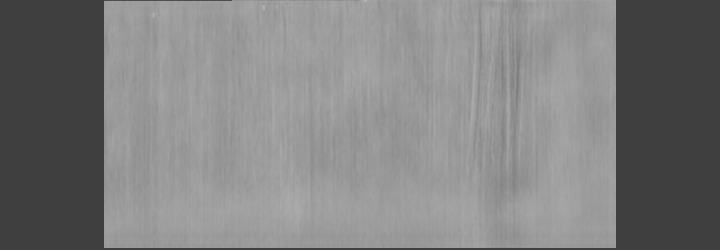
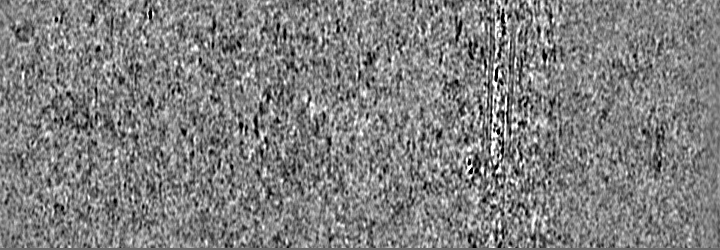
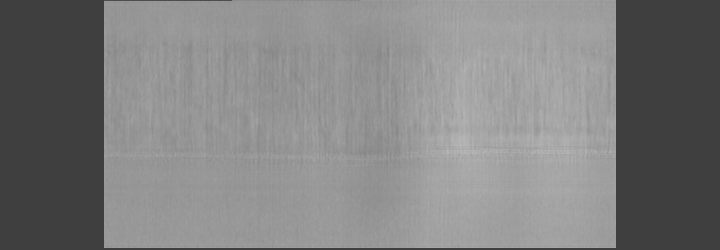
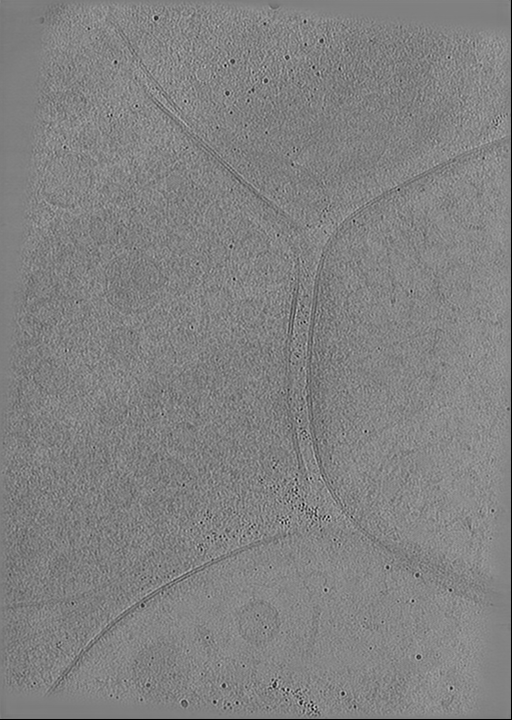
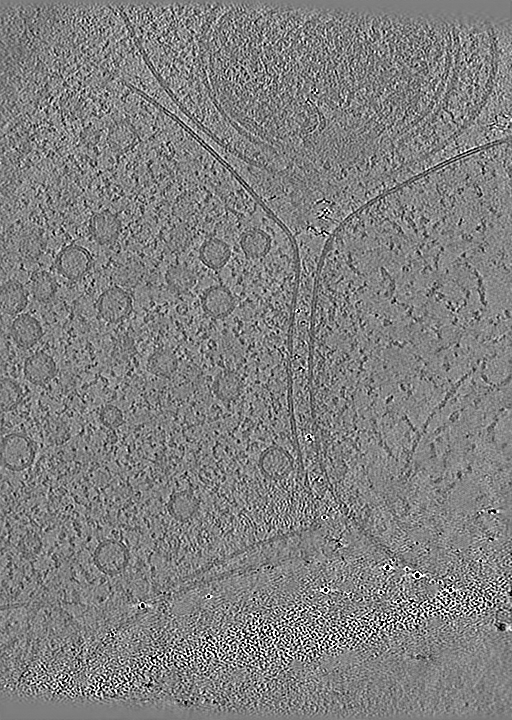
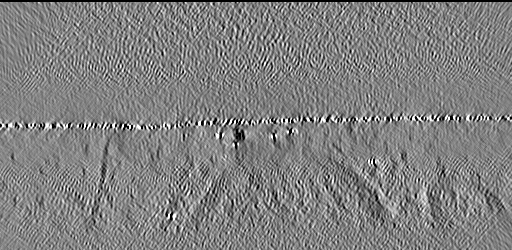
 Map data Map data | CryoCARE denoised tomogram of a cultured neuronal synapse. | |||||||||
 Sample Sample |
| |||||||||
 Keywords Keywords | Synapse / Neuron / Vesicles / EXOCYTOSIS | |||||||||
| Biological species |  | |||||||||
| Method | electron tomography / cryo EM | |||||||||
 Authors Authors | Held RG / Brunger AT / Liang J | |||||||||
| Funding support |  United States, 2 items United States, 2 items
| |||||||||
 Citation Citation | Journal: Proc Natl Acad Sci U S A / Year: 2024 Title: Nanoscale architecture of synaptic vesicles and scaffolding complexes revealed by cryo-electron tomography. Authors: Richard G Held / Jiahao Liang / Axel T Brunger / Abstract: The spatial distribution of proteins and their arrangement within the cellular ultrastructure regulates the opening of α-amino-3-hydroxy-5-methyl-4-isoxazolepropionic acid (AMPA) receptors in ...The spatial distribution of proteins and their arrangement within the cellular ultrastructure regulates the opening of α-amino-3-hydroxy-5-methyl-4-isoxazolepropionic acid (AMPA) receptors in response to glutamate release at the synapse. Fluorescence microscopy imaging revealed that the postsynaptic density (PSD) and scaffolding proteins in the presynaptic active zone (AZ) align across the synapse to form a trans-synaptic "nanocolumn," but the relation to synaptic vesicle release sites is uncertain. Here, we employ focused-ion beam (FIB) milling and cryoelectron tomography to image synapses under near-native conditions. Improved image contrast, enabled by FIB milling, allows simultaneous visualization of supramolecular nanoclusters within the AZ and PSD and synaptic vesicles. Surprisingly, membrane-proximal synaptic vesicles, which fuse to release glutamate, are not preferentially aligned with AZ or PSD nanoclusters. These synaptic vesicles are linked to the membrane by peripheral protein densities, often consistent in size and shape with Munc13, as well as globular densities bridging the synaptic vesicle and plasma membrane, consistent with prefusion complexes of SNAREs, synaptotagmins, and complexin. Monte Carlo simulations of synaptic transmission events using biorealistic models guided by our tomograms predict that clustering AMPARs within PSD nanoclusters increases the variability of the postsynaptic response but not its average amplitude. Together, our data support a model in which synaptic strength is tuned at the level of single vesicles by the spatial relationship between scaffolding nanoclusters and single synaptic vesicle fusion sites. | |||||||||
| History |
|
- Structure visualization
| Supplemental images |
|---|

- Downloads & links
-EMDB archive
| Map data | emd_45161.map.gz | 103.6 MB |  EMDB map data format EMDB map data format | |
|---|---|---|---|---|
| Header (meta data) | emd-45161-v30.xmlemd-45161.xml | 40.3 KB 40.3 KB | Display Display | EMDB header |
| Images |  emd_45161.png emd_45161.png | 219.7 KB | ||
| Filedesc metadata | emd-45161.cif.gz | 5.4 KB | ||
| Others | emd_45161_additional_1.map.gzemd_45161_additional_10.map.gzemd_45161_additional_11.map.gzemd_45161_additional_12.map.gzemd_45161_additional_2.map.gzemd_45161_additional_3.map.gzemd_45161_additional_4.map.gzemd_45161_additional_5.map.gzemd_45161_additional_6.map.gzemd_45161_additional_7.map.gzemd_45161_additional_8.map.gzemd_45161_additional_9.map.gz | 318.8 MB 320.7 MB 289.7 MB 287.1 MB 291.3 MB 294.6 MB 300.6 MB 298.6 MB 297.4 MB 303.7 MB 311.8 MB 323.1 MB | ||
| Archive directory |  http://ftp.pdbj.org/pub/emdb/structures/EMD-45161ftp://ftp.pdbj.org/pub/emdb/structures/EMD-45161 http://ftp.pdbj.org/pub/emdb/structures/EMD-45161ftp://ftp.pdbj.org/pub/emdb/structures/EMD-45161 | HTTPS FTP |
-Links
| EMDB pages | EMDB (EBI/PDBe) / EMDataResource |
|---|
-Map
| File | Download / File: emd_45161.map.gz / Format: CCP4 / Size: 120.9 MB / Type: IMAGE STORED AS FLOATING POINT NUMBER (4 BYTES) | ||||||||||||||||||||||||||||||||
|---|---|---|---|---|---|---|---|---|---|---|---|---|---|---|---|---|---|---|---|---|---|---|---|---|---|---|---|---|---|---|---|---|---|
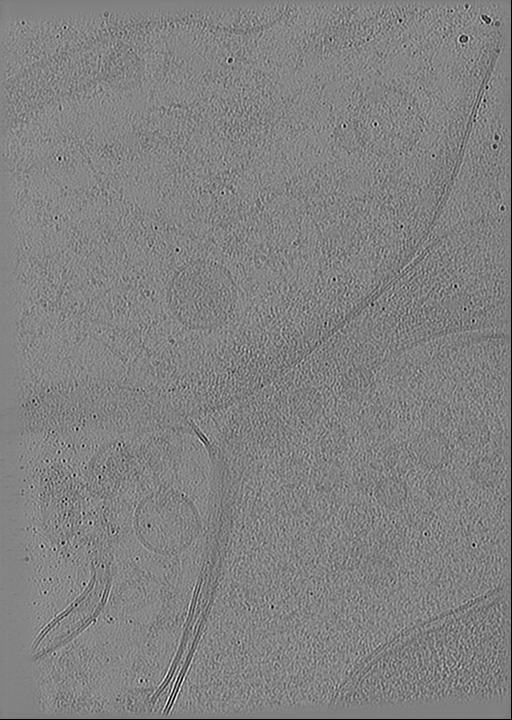
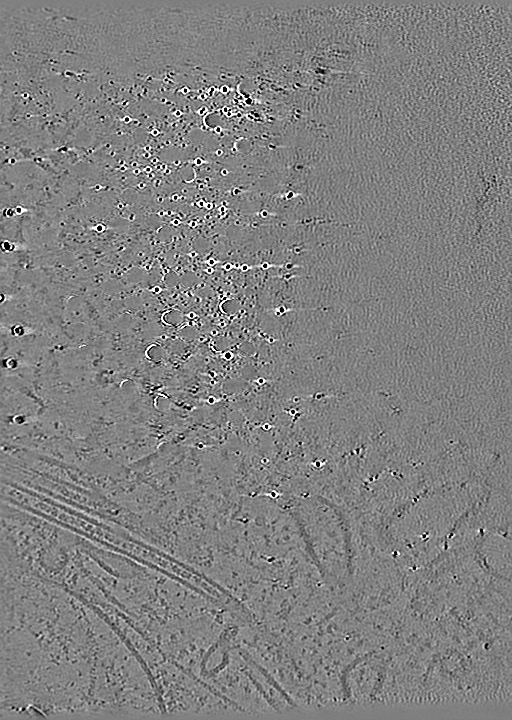
| Annotation | CryoCARE denoised tomogram of a cultured neuronal synapse. | ||||||||||||||||||||||||||||||||
| Projections & slices | Image control
Images are generated by Spider. generated in cubic-lattice coordinate | ||||||||||||||||||||||||||||||||
| Voxel size | X=Y=Z: 13.6 Å | ||||||||||||||||||||||||||||||||
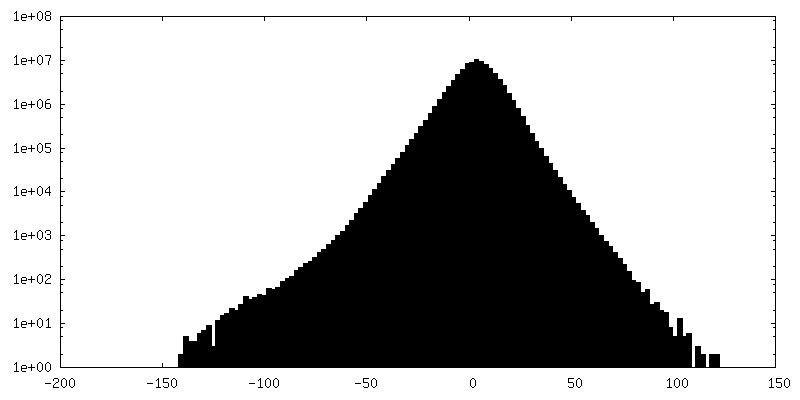
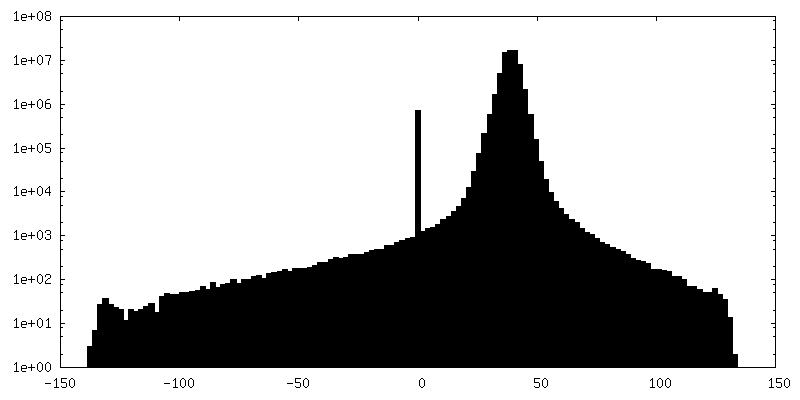
| Density |
| ||||||||||||||||||||||||||||||||
| Symmetry | Space group: 1 | ||||||||||||||||||||||||||||||||
| Details | EMDB XML:
|
 Z (Sec.)
 Y (Row.)
 X (Col.)


-Supplemental data
+Additional map: CryoCARE denoised tomogram of a cultured neuronal synapse.


+Additional map: CryoCARE denoised tomogram of a cultured neuronal synapse.


+Additional map: CryoCARE denoised tomogram of a cultured neuronal synapse.


+Additional map: CryoCARE denoised tomogram of a cultured neuronal synapse.


+Additional map: CryoCARE denoised tomogram of a cultured neuronal synapse.


+Additional map: CryoCARE denoised tomogram of a cultured neuronal synapse.


+Additional map: CryoCARE denoised tomogram of a cultured neuronal synapse.


+Additional map: CryoCARE denoised tomogram of a cultured neuronal synapse.


+Additional map: CryoCARE denoised tomogram of a cultured neuronal synapse.


+Additional map: CryoCARE denoised tomogram of a cultured neuronal synapse.


+Additional map: CryoCARE denoised tomogram of a cultured neuronal synapse.


+Additional map: CryoCARE denoised tomogram of a cultured neuronal synapse.


- Sample components
-Entire : Tomograms of Cultured Neuronal Synapses
| Entire | Name: Tomograms of Cultured Neuronal Synapses |
|---|---|
| Components |
|
-Supramolecule #1: Tomograms of Cultured Neuronal Synapses
| Supramolecule | Name: Tomograms of Cultured Neuronal Synapses / type: cell / ID: 1 / Parent: 0 Details: Tomograms of cryo-FIB lamellae of from cultured neurons. |
|---|---|
| Source (natural) | Organism: |
-Experimental details
-Structure determination
| Method | cryo EM |
|---|---|
 Processing Processing | electron tomography |
| Aggregation state | cell |
-Sample preparation
| Buffer | pH: 7.4 |
|---|---|
| Grid | Model: Quantifoil R2/2 / Material: GOLD / Mesh: 200 / Support film - Material: CARBON / Support film - topology: HOLEY / Pretreatment - Type: GLOW DISCHARGE / Pretreatment - Time: 45 sec. / Pretreatment - Atmosphere: AIR |
| Vitrification | Cryogen name: ETHANE / Chamber humidity: 95 % / Chamber temperature: 298 K / Instrument: LEICA EM GP |
| Details | tomograms from FIB-milled lamellae of cultured mouse hippocampal neurons, targeting neuronal synapses. |
| Sectioning | Focused ion beam - Instrument: OTHER / Focused ion beam - Ion: OTHER / Focused ion beam - Voltage: 30 / Focused ion beam - Current: 0.03 / Focused ion beam - Duration: 600 / Focused ion beam - Temperature: 83 K / Focused ion beam - Initial thickness: 1000 / Focused ion beam - Final thickness: 175 Focused ion beam - Details: The milling sequence was the following (all at 30 keV): rough milling: 0.3 nA, 3 um pattern separation in Y; medium milling: 0.1 nA, 1 um pattern separation; fine milling: ...Focused ion beam - Details: The milling sequence was the following (all at 30 keV): rough milling: 0.3 nA, 3 um pattern separation in Y; medium milling: 0.1 nA, 1 um pattern separation; fine milling: 50 pA, 500 nm pattern separation; polishing: 30 pA, 175 nm pattern separation.. The value given for _em_focused_ion_beam.instrument is TFS Aquilos 2. This is not in a list of allowed values {'OTHER', 'DB235'} so OTHER is written into the XML file. |
| Fiducial marker | Diameter: 2.5 nm |
- Electron microscopy
| Microscope | TFS KRIOS |
|---|---|
| Specialist optics | Energy filter - Name: GIF Bioquantum / Energy filter - Slit width: 20 eV |
| Image recording | Film or detector model: GATAN K3 BIOQUANTUM (6k x 4k) / Average electron dose: 3.2 e/Å2 |
| Electron beam | Acceleration voltage: 300 kV / Electron source:  FIELD EMISSION GUN FIELD EMISSION GUN |
| Electron optics | Illumination mode: FLOOD BEAM / Imaging mode: BRIGHT FIELD / Nominal defocus max: 9.0 µm / Nominal defocus min: 3.0 µm |
| Sample stage | Specimen holder model: FEI TITAN KRIOS AUTOGRID HOLDER / Cooling holder cryogen: NITROGEN |
| Experimental equipment |  Model: Titan Krios / Image courtesy: FEI Company |
-Image processing
| Final reconstruction | Algorithm: BACK PROJECTION / Software - Name: IMOD Details: IMOD was used for tilt-series alignment and weighted back-projection, followed by denoising using CryoCARE. Number images used: 41 |
|---|
