 Movie
Movie Controller

[English] 日本語
 Yorodumi
- EMDB-18475: Cryo-electron tomogram of an induced S2 cell protrusion. The cell... -
+ Open data

- Basic information
| Entry |  | |||||||||
|---|---|---|---|---|---|---|---|---|---|---|
| Title | Cryo-electron tomogram of an induced S2 cell protrusion. The cell was treated with 2uM thapsigargin (5h) and with 2.5uM Cytochalasin D (2h). | |||||||||
 Map data Map data | Cryo-electron tomogram of an induced S2 cell protrusion after treatment with 2.5uM CytD (2h) and 2um thapsigargin (5h). | |||||||||
 Sample Sample |
| |||||||||
 Keywords Keywords | microtubules / protrusion / STRUCTURAL PROTEIN | |||||||||
| Biological species |  | |||||||||
| Method | electron tomography / cryo EM | |||||||||
 Authors Authors | Ventura Santos C / Carter AP | |||||||||
| Funding support |  United Kingdom, 2 items United Kingdom, 2 items
| |||||||||
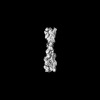
 Citation Citation | Journal: EMBO Rep / Year: 2023 Title: CryoET shows cofilactin filaments inside the microtubule lumen. Authors: Camilla Ventura Santos / Stephen L Rogers / Andrew P Carter /  Abstract: Cytoplasmic microtubules are tubular polymers that can harbor small proteins or filaments inside their lumen. The identities of these objects and mechanisms for their accumulation have not been ...Cytoplasmic microtubules are tubular polymers that can harbor small proteins or filaments inside their lumen. The identities of these objects and mechanisms for their accumulation have not been conclusively established. Here, we used cryogenic electron tomography of Drosophila S2 cell protrusions and found filaments inside the microtubule lumen, which resemble those reported recently in human HAP1 cells. The frequency of these filaments increased upon inhibition of the sarco/endoplasmic reticulum Ca ATPase with the small molecule drug thapsigargin. Subtomogram averaging showed that the luminal filaments adopt a helical structure reminiscent of cofilin-bound actin (cofilactin). Consistent with this, we observed cofilin dephosphorylation, an activating modification, in cells under the same conditions that increased luminal filament occurrence. Furthermore, RNA interference knock-down of cofilin reduced the frequency of luminal filaments with cofilactin morphology. These results suggest that cofilin activation stimulates its accumulation on actin filaments inside the microtubule lumen. | |||||||||
| History |
|
- Structure visualization
| Supplemental images |
|---|

- Downloads & links
-EMDB archive
| Map data | emd_18475.map.gz | 1.9 GB |  EMDB map data format EMDB map data format | |
|---|---|---|---|---|
| Header (meta data) | emd-18475-v30.xmlemd-18475.xml | 11.5 KB 11.5 KB | Display Display | EMDB header |
| Images | 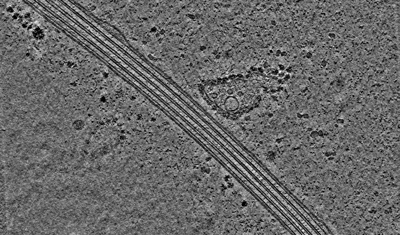 emd_18475.png emd_18475.png | 143.7 KB | ||
| Filedesc metadata | emd-18475.cif.gz | 4.1 KB | ||
| Archive directory |  http://ftp.pdbj.org/pub/emdb/structures/EMD-18475ftp://ftp.pdbj.org/pub/emdb/structures/EMD-18475 http://ftp.pdbj.org/pub/emdb/structures/EMD-18475ftp://ftp.pdbj.org/pub/emdb/structures/EMD-18475 | HTTPS FTP |
-Related structure data
-Links
| EMDB pages | EMDB (EBI/PDBe) / EMDataResource |
|---|
-Map
| File | Download / File: emd_18475.map.gz / Format: CCP4 / Size: 2.1 GB / Type: IMAGE STORED AS FLOATING POINT NUMBER (4 BYTES) | ||||||||||||||||||||||||||||||||
|---|---|---|---|---|---|---|---|---|---|---|---|---|---|---|---|---|---|---|---|---|---|---|---|---|---|---|---|---|---|---|---|---|---|
| Annotation | Cryo-electron tomogram of an induced S2 cell protrusion after treatment with 2.5uM CytD (2h) and 2um thapsigargin (5h). | ||||||||||||||||||||||||||||||||
| Projections & slices | Image control
Images are generated by Spider. generated in cubic-lattice coordinate | ||||||||||||||||||||||||||||||||
| Voxel size | X=Y=Z: 10.74 Å | ||||||||||||||||||||||||||||||||
| Density |
| ||||||||||||||||||||||||||||||||
| Symmetry | Space group: 1 | ||||||||||||||||||||||||||||||||
| Details | EMDB XML:
|
 Z (Sec.)
 Y (Row.)
 X (Col.)


-Supplemental data
- Sample components
-Entire : Cytochalasin D-induced protrusion of a Drosophila S2 cell.
| Entire | Name: Cytochalasin D-induced protrusion of a Drosophila S2 cell. |
|---|---|
| Components |
|
-Supramolecule #1: Cytochalasin D-induced protrusion of a Drosophila S2 cell.
| Supramolecule | Name: Cytochalasin D-induced protrusion of a Drosophila S2 cell. type: cell / ID: 1 / Parent: 0 Details: Cells were treated with 2uM thapsigargin for 5h and with 2.5uM Cytochalasin D for 2h prior to vitrification. |
|---|---|
| Source (natural) | Organism: |
-Experimental details
-Structure determination
| Method | cryo EM |
|---|---|
 Processing Processing | electron tomography |
| Aggregation state | cell |
-Sample preparation
| Buffer | pH: 7 |
|---|---|
| Grid | Model: Quantifoil R3.5/1 / Material: GOLD / Mesh: 200 / Pretreatment - Type: GLOW DISCHARGE / Pretreatment - Time: 30 sec. Details: Grids were glow discharged for 30s at 20mA and then coated with 0.25ug/mL Concanavalin A. Grids were washed twice with PBS before plating cells. |
| Vitrification | Cryogen name: ETHANE / Chamber humidity: 95 % / Chamber temperature: 298 K / Instrument: FEI VITROBOT MARK III |
| Sectioning | Other: NO SECTIONING |
| Fiducial marker | Manufacturer: BBI Solutions / Diameter: 10 nm |
- Electron microscopy
| Microscope | FEI TITAN KRIOS |
|---|---|
| Image recording | Film or detector model: GATAN K3 (6k x 4k) / Average exposure time: 0.56 sec. / Average electron dose: 2.9 e/Å2 |
| Electron beam | Acceleration voltage: 300 kV / Electron source:  FIELD EMISSION GUN FIELD EMISSION GUN |
| Electron optics | Illumination mode: FLOOD BEAM / Imaging mode: BRIGHT FIELD / Nominal defocus max: 4.0 µm / Nominal defocus min: 3.0 µm |
| Experimental equipment |  Model: Titan Krios / Image courtesy: FEI Company |
-Image processing
| Details | The tomogram has been binned by 4 and deconvolved in Warp. |
|---|---|
| Final reconstruction | Software - Name: Warp (ver. 1.0.9) / Number images used: 41 |
