+ Open data
- Basic information
| Entry | Database: EMDB / ID: EMD-4356 | ||||||||||||
|---|---|---|---|---|---|---|---|---|---|---|---|---|---|
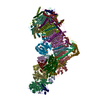
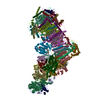
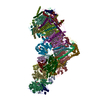
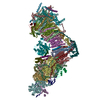
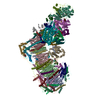
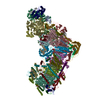
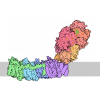
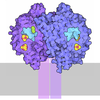
| Title | Mouse mitochondrial complex I in the deactive state | ||||||||||||
 Map data Map data | Mouse mitochondrial complex I in the deactive state | ||||||||||||
 Sample Sample |
| ||||||||||||
 Keywords Keywords | Complex I / mitochondria / proton pump / membrane protein / oxidoreductase | ||||||||||||
| Function / homology |  Function and homology information Function and homology informationMitochondrial protein import / response to injury involved in regulation of muscle adaptation / Protein lipoylation / Mitochondrial Fatty Acid Beta-Oxidation / Complex I biogenesis / RHOG GTPase cycle / Respiratory electron transport / protein insertion into mitochondrial inner membrane / blastocyst hatching / respiratory system process ...Mitochondrial protein import / response to injury involved in regulation of muscle adaptation / Protein lipoylation / Mitochondrial Fatty Acid Beta-Oxidation / Complex I biogenesis / RHOG GTPase cycle / Respiratory electron transport / protein insertion into mitochondrial inner membrane / blastocyst hatching / respiratory system process / psychomotor behavior / Mitochondrial protein degradation / response to light intensity / cellular response to oxygen levels / iron-sulfur cluster assembly complex / mesenchymal stem cell proliferation / reproductive system development / mitochondrial large ribosomal subunit binding / respiratory chain complex / gliogenesis / mitochondrial [2Fe-2S] assembly complex / mesenchymal stem cell differentiation / circulatory system development / negative regulation of non-canonical NF-kappaB signal transduction / adult walking behavior / cardiac muscle tissue development / positive regulation of mitochondrial membrane potential / response to hydroperoxide / neural precursor cell proliferation / [2Fe-2S] cluster assembly / oxygen sensor activity / cellular response to glucocorticoid stimulus / stem cell division / NADH dehydrogenase activity / iron-sulfur cluster assembly / dopamine metabolic process / adult behavior / NADH:ubiquinone reductase (H+-translocating) / mitochondrial ATP synthesis coupled electron transport / positive regulation of ATP biosynthetic process / mitochondrial respiratory chain complex I assembly / proton motive force-driven mitochondrial ATP synthesis / mitochondrial electron transport, NADH to ubiquinone / respiratory chain complex I / positive regulation of execution phase of apoptosis / NADH dehydrogenase (ubiquinone) activity / neuron development / quinone binding / ATP synthesis coupled electron transport / cellular response to interferon-beta / negative regulation of reactive oxygen species biosynthetic process / tricarboxylic acid cycle / extrinsic apoptotic signaling pathway / cellular response to retinoic acid / neurogenesis / Neutrophil degranulation / visual perception / reactive oxygen species metabolic process / muscle contraction / aerobic respiration / cerebellum development / regulation of mitochondrial membrane potential / respiratory electron transport chain / response to nicotine / response to cocaine / mitochondrion organization / DNA damage response, signal transduction by p53 class mediator / kidney development / monooxygenase activity / response to hydrogen peroxide / sensory perception of sound / electron transport chain / fatty acid metabolic process / circadian rhythm / brain development / mitochondrial intermembrane space / 2 iron, 2 sulfur cluster binding / mitochondrial membrane / cognition / multicellular organism growth / NAD binding / fatty acid biosynthetic process / positive regulation of protein catabolic process / cellular senescence / FMN binding / nervous system development / myelin sheath / 4 iron, 4 sulfur cluster binding / response to oxidative stress / neuron apoptotic process / response to ethanol / gene expression / in utero embryonic development / response to hypoxia / electron transfer activity / mitochondrial inner membrane / nuclear speck / nuclear body / mitochondrial matrix / response to xenobiotic stimulus Similarity search - Function | ||||||||||||
| Biological species |  | ||||||||||||
| Method | single particle reconstruction / cryo EM / Resolution: 3.9 Å | ||||||||||||
 Authors Authors | Agip ANA / Blaza JN | ||||||||||||
| Funding support |  United Kingdom, 3 items United Kingdom, 3 items
| ||||||||||||
 Citation Citation |  Journal: Nat Struct Mol Biol / Year: 2018 Journal: Nat Struct Mol Biol / Year: 2018Title: Cryo-EM structures of complex I from mouse heart mitochondria in two biochemically defined states. Authors: Ahmed-Noor A Agip / James N Blaza / Hannah R Bridges / Carlo Viscomi / Shaun Rawson / Stephen P Muench / Judy Hirst /  Abstract: Complex I (NADH:ubiquinone oxidoreductase) uses the reducing potential of NADH to drive protons across the energy-transducing inner membrane and power oxidative phosphorylation in mammalian ...Complex I (NADH:ubiquinone oxidoreductase) uses the reducing potential of NADH to drive protons across the energy-transducing inner membrane and power oxidative phosphorylation in mammalian mitochondria. Recent cryo-EM analyses have produced near-complete models of all 45 subunits in the bovine, ovine and porcine complexes and have identified two states relevant to complex I in ischemia-reperfusion injury. Here, we describe the 3.3-Å structure of complex I from mouse heart mitochondria, a biomedically relevant model system, in the 'active' state. We reveal a nucleotide bound in subunit NDUFA10, a nucleoside kinase homolog, and define mechanistically critical elements in the mammalian enzyme. By comparisons with a 3.9-Å structure of the 'deactive' state and with known bacterial structures, we identify differences in helical geometry in the membrane domain that occur upon activation or that alter the positions of catalytically important charged residues. Our results demonstrate the capability of cryo-EM analyses to challenge and develop mechanistic models for mammalian complex I. | ||||||||||||
| History |
|
- Structure visualization
| Movie |
 Movie viewer Movie viewer |
|---|---|
| Structure viewer | EM map:  SurfView SurfView Molmil Molmil Jmol/JSmol Jmol/JSmol |
| Supplemental images |
- Downloads & links
-EMDB archive
| Map data |  emd_4356.map.gz emd_4356.map.gz | 172 MB |  EMDB map data format EMDB map data format | |
|---|---|---|---|---|
| Header (meta data) |  emd-4356-v30.xml emd-4356-v30.xml emd-4356.xml emd-4356.xml | 70.5 KB 70.5 KB | Display Display |  EMDB header EMDB header |
| FSC (resolution estimation) |  emd_4356_fsc.xml emd_4356_fsc.xml | 12.9 KB | Display |  FSC data file FSC data file |
| Images |  emd_4356.png emd_4356.png | 97.2 KB | ||
| Filedesc metadata |  emd-4356.cif.gz emd-4356.cif.gz | 14.3 KB | ||
| Others |  emd_4356_half_map_1.map.gz emd_4356_half_map_1.map.gz emd_4356_half_map_2.map.gz emd_4356_half_map_2.map.gz | 146.1 MB 146 MB | ||
| Archive directory |  http://ftp.pdbj.org/pub/emdb/structures/EMD-4356 http://ftp.pdbj.org/pub/emdb/structures/EMD-4356 ftp://ftp.pdbj.org/pub/emdb/structures/EMD-4356 ftp://ftp.pdbj.org/pub/emdb/structures/EMD-4356 | HTTPS FTP |
-Validation report
| Summary document |  emd_4356_validation.pdf.gz emd_4356_validation.pdf.gz | 1.2 MB | Display |  EMDB validaton report EMDB validaton report |
|---|---|---|---|---|
| Full document |  emd_4356_full_validation.pdf.gz emd_4356_full_validation.pdf.gz | 1.2 MB | Display | |
| Data in XML |  emd_4356_validation.xml.gz emd_4356_validation.xml.gz | 19.7 KB | Display | |
| Data in CIF |  emd_4356_validation.cif.gz emd_4356_validation.cif.gz | 26.4 KB | Display | |
| Arichive directory |  https://ftp.pdbj.org/pub/emdb/validation_reports/EMD-4356 https://ftp.pdbj.org/pub/emdb/validation_reports/EMD-4356 ftp://ftp.pdbj.org/pub/emdb/validation_reports/EMD-4356 ftp://ftp.pdbj.org/pub/emdb/validation_reports/EMD-4356 | HTTPS FTP |
-Related structure data
| Related structure data | 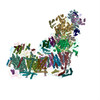 6g72MC 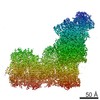 4345C  6g2jC C: citing same article ( M: atomic model generated by this map |
|---|---|
| Similar structure data | |
| EM raw data |  EMPIAR-10604 (Title: Single particle cryo-EM dataset of Mus musculus mitochondrial complex I in the deactive state EMPIAR-10604 (Title: Single particle cryo-EM dataset of Mus musculus mitochondrial complex I in the deactive stateData size: 2.7 TB Data #1: Single particle cryo-EM dataset of Mus musculus mitochondrial complex I in the deactive state [micrographs - multiframe]) |
- Links
Links
| EMDB pages |  EMDB (EBI/PDBe) / EMDB (EBI/PDBe) /  EMDataResource EMDataResource |
|---|---|
| Related items in Molecule of the Month |
- Map
Map
| File |  Download / File: emd_4356.map.gz / Format: CCP4 / Size: 184 MB / Type: IMAGE STORED AS FLOATING POINT NUMBER (4 BYTES) Download / File: emd_4356.map.gz / Format: CCP4 / Size: 184 MB / Type: IMAGE STORED AS FLOATING POINT NUMBER (4 BYTES) | ||||||||||||||||||||||||||||||||||||||||||||||||||||||||||||
|---|---|---|---|---|---|---|---|---|---|---|---|---|---|---|---|---|---|---|---|---|---|---|---|---|---|---|---|---|---|---|---|---|---|---|---|---|---|---|---|---|---|---|---|---|---|---|---|---|---|---|---|---|---|---|---|---|---|---|---|---|---|
| Annotation | Mouse mitochondrial complex I in the deactive state | ||||||||||||||||||||||||||||||||||||||||||||||||||||||||||||
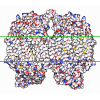
| Projections & slices | Image control
Images are generated by Spider. | ||||||||||||||||||||||||||||||||||||||||||||||||||||||||||||
| Voxel size | X=Y=Z: 1.33 Å | ||||||||||||||||||||||||||||||||||||||||||||||||||||||||||||
| Density |
| ||||||||||||||||||||||||||||||||||||||||||||||||||||||||||||
| Symmetry | Space group: 1 | ||||||||||||||||||||||||||||||||||||||||||||||||||||||||||||
| Details | EMDB XML:
CCP4 map header:
| ||||||||||||||||||||||||||||||||||||||||||||||||||||||||||||
-Supplemental data
-Half map: Half-1
| File | emd_4356_half_map_1.map | ||||||||||||
|---|---|---|---|---|---|---|---|---|---|---|---|---|---|
| Annotation | Half-1 | ||||||||||||
| Projections & Slices |
| ||||||||||||
| Density Histograms |
-Half map: Half-2
| File | emd_4356_half_map_2.map | ||||||||||||
|---|---|---|---|---|---|---|---|---|---|---|---|---|---|
| Annotation | Half-2 | ||||||||||||
| Projections & Slices |
| ||||||||||||
| Density Histograms |
- Sample components
+Entire : Mitochondrial complex I from mouse in the deactive state
+Supramolecule #1: Mitochondrial complex I from mouse in the deactive state
+Macromolecule #1: NADH-ubiquinone oxidoreductase chain 3
+Macromolecule #2: NADH dehydrogenase [ubiquinone] iron-sulfur protein 7, mitochondrial
+Macromolecule #3: NADH dehydrogenase [ubiquinone] iron-sulfur protein 3, mitochondrial
+Macromolecule #4: NADH dehydrogenase [ubiquinone] iron-sulfur protein 2, mitochondrial
+Macromolecule #5: NADH dehydrogenase [ubiquinone] flavoprotein 2, mitochondrial
+Macromolecule #6: NADH dehydrogenase [ubiquinone] flavoprotein 1, mitochondrial
+Macromolecule #7: NADH-ubiquinone oxidoreductase 75 kDa subunit, mitochondrial
+Macromolecule #8: NADH-ubiquinone oxidoreductase chain 1
+Macromolecule #9: NADH dehydrogenase [ubiquinone] iron-sulfur protein 8, mitochondrial
+Macromolecule #10: NADH-ubiquinone oxidoreductase chain 6
+Macromolecule #11: NADH-ubiquinone oxidoreductase chain 4L
+Macromolecule #12: NADH-ubiquinone oxidoreductase chain 5
+Macromolecule #13: NADH-ubiquinone oxidoreductase chain 4
+Macromolecule #14: NADH-ubiquinone oxidoreductase chain 2
+Macromolecule #15: NADH dehydrogenase [ubiquinone] 1 alpha subcomplex subunit 10, mi...
+Macromolecule #16: NADH dehydrogenase [ubiquinone] 1 alpha subcomplex subunit 9, mit...
+Macromolecule #17: NADH dehydrogenase [ubiquinone] iron-sulfur protein 4, mitochondrial
+Macromolecule #18: NADH dehydrogenase [ubiquinone] iron-sulfur protein 6, mitochondrial
+Macromolecule #19: NADH dehydrogenase [ubiquinone] 1 alpha subcomplex subunit 2
+Macromolecule #20: Acyl carrier protein, mitochondrial
+Macromolecule #21: NADH dehydrogenase [ubiquinone] 1 alpha subcomplex subunit 5
+Macromolecule #22: NADH dehydrogenase [ubiquinone] 1 alpha subcomplex subunit 6
+Macromolecule #23: NADH dehydrogenase [ubiquinone] 1 alpha subcomplex subunit 8
+Macromolecule #24: MCG5603
+Macromolecule #25: NADH dehydrogenase [ubiquinone] 1 alpha subcomplex subunit 13
+Macromolecule #26: NADH dehydrogenase [ubiquinone] 1 alpha subcomplex subunit 1
+Macromolecule #27: NADH dehydrogenase [ubiquinone] 1 alpha subcomplex subunit 3
+Macromolecule #28: NADH dehydrogenase [ubiquinone] 1 subunit C1, mitochondrial
+Macromolecule #29: NADH dehydrogenase [ubiquinone] 1 subunit C2
+Macromolecule #30: NADH dehydrogenase [ubiquinone] iron-sulfur protein 5
+Macromolecule #31: NADH dehydrogenase [ubiquinone] 1 beta subcomplex subunit 1
+Macromolecule #32: NADH dehydrogenase [ubiquinone] 1 beta subcomplex subunit 11, mit...
+Macromolecule #33: NADH dehydrogenase [ubiquinone] 1 beta subcomplex subunit 5, mito...
+Macromolecule #34: NADH dehydrogenase [ubiquinone] 1 beta subcomplex subunit 6
+Macromolecule #35: NADH dehydrogenase [ubiquinone] 1 beta subcomplex subunit 2, mito...
+Macromolecule #36: NADH dehydrogenase [ubiquinone] 1 beta subcomplex subunit 3
+Macromolecule #37: NADH dehydrogenase [ubiquinone] 1 beta subcomplex subunit 8, mito...
+Macromolecule #38: NADH dehydrogenase [ubiquinone] 1 beta subcomplex subunit 4
+Macromolecule #39: NADH dehydrogenase [ubiquinone] 1 beta subcomplex subunit 9
+Macromolecule #40: NADH dehydrogenase [ubiquinone] 1 beta subcomplex subunit 7
+Macromolecule #41: NADH dehydrogenase [ubiquinone] 1 beta subcomplex subunit 10
+Macromolecule #42: NADH dehydrogenase [ubiquinone] 1 alpha subcomplex subunit 12
+Macromolecule #43: NADH dehydrogenase [ubiquinone] 1 alpha subcomplex subunit 7
+Macromolecule #44: NADH dehydrogenase [ubiquinone] flavoprotein 3, mitochondrial
+Macromolecule #45: IRON/SULFUR CLUSTER
+Macromolecule #46: FE2/S2 (INORGANIC) CLUSTER
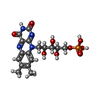
+Macromolecule #47: FLAVIN MONONUCLEOTIDE
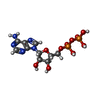
+Macromolecule #48: ADENOSINE-5'-DIPHOSPHATE
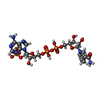
+Macromolecule #49: NADPH DIHYDRO-NICOTINAMIDE-ADENINE-DINUCLEOTIDE PHOSPHATE
+Macromolecule #50: ZINC ION
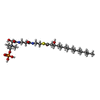
+Macromolecule #51: ~{S}-[2-[3-[[(2~{R})-3,3-dimethyl-2-oxidanyl-4-phosphonooxy-butan...
+Macromolecule #52: ACETYL GROUP
-Experimental details
-Structure determination
| Method | cryo EM |
|---|---|
 Processing Processing | single particle reconstruction |
| Aggregation state | particle |
- Sample preparation
| Concentration | 3 mg/mL | ||||||||||||
|---|---|---|---|---|---|---|---|---|---|---|---|---|---|
| Buffer | pH: 7.14 Component:
| ||||||||||||
| Grid | Model: Quantifoil UltrAuFoil / Material: GOLD / Mesh: 300 Details: Gold was PEGylated prior to use in anaerobic ethanol in 5mM SPT-11P6 (Sensopath Technologies) for two days 0.6/1 holes | ||||||||||||
| Vitrification | Cryogen name: ETHANE / Chamber humidity: 100 % / Chamber temperature: 277 K / Instrument: FEI VITROBOT MARK IV / Details: 8-16s blotting.. | ||||||||||||
| Details | Peak fraction from a gel filtration column- monodisperse and not concentrated. The complex was put into the deactive state by heating at 37degC for 30 mins before isolation in detergent. |
- Electron microscopy
| Microscope | FEI TITAN KRIOS |
|---|---|
| Specialist optics | Energy filter - Name: GIF Quantum LS / Energy filter - Lower energy threshold: 0 eV / Energy filter - Upper energy threshold: 20 eV |
| Image recording | Film or detector model: GATAN K2 QUANTUM (4k x 4k) / Detector mode: COUNTING / Digitization - Frames/image: 1-30 / Number grids imaged: 1 / Average exposure time: 15.0 sec. / Average electron dose: 50.0 e/Å2 |
| Electron beam | Acceleration voltage: 300 kV / Electron source:  FIELD EMISSION GUN FIELD EMISSION GUN |
| Electron optics | Calibrated magnification: 37600 / Illumination mode: FLOOD BEAM / Imaging mode: BRIGHT FIELD / Cs: 2.7 mm / Nominal defocus max: 3.4 µm / Nominal defocus min: 2.2 µm |
| Sample stage | Specimen holder model: FEI TITAN KRIOS AUTOGRID HOLDER / Cooling holder cryogen: NITROGEN |
| Experimental equipment | 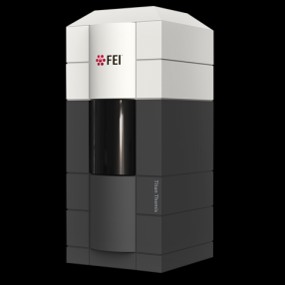 Model: Titan Krios / Image courtesy: FEI Company |
+ Image processing
-Atomic model buiding 1
| Details | Used default paramteres in phenix.real_space_refine |
|---|---|
| Refinement | Space: REAL / Protocol: FLEXIBLE FIT |
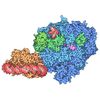
| Output model |  PDB-6g72: |
 Movie
Movie Controller

















 Z (Sec.)
 Y (Row.)
 X (Col.)


