 ムービー
ムービー コントローラー


+ データを開く

- 基本情報
基本情報
| 登録情報 | データベース: EMDB / ID: EMD-8992 | ||||||||||||||||||
|---|---|---|---|---|---|---|---|---|---|---|---|---|---|---|---|---|---|---|---|
| タイトル | Cryo-electron tomogram of mouse rod connecting cilium and mother centriole with C9 sub-tomogram averaging | ||||||||||||||||||
 マップデータ マップデータ | Map derived from C9 sub-tomogram averaging of B04.mrc. Used to generate Fig. 1a(1,3) and 1b-1h. | ||||||||||||||||||
 試料 試料 |
| ||||||||||||||||||
| 生物種 |  | ||||||||||||||||||
| 手法 | 電子線トモグラフィー法 / クライオ電子顕微鏡法 | ||||||||||||||||||
 データ登録者 データ登録者 | Zhang Z / Liu J / Schmid MF / Wensel TG | ||||||||||||||||||
| 資金援助 |  米国, 5件 米国, 5件
| ||||||||||||||||||
 引用 引用 | ジャーナル: Proc Natl Acad Sci U S A / 年: 2019 タイトル: Defining the layers of a sensory cilium with STORM and cryoelectron nanoscopy. 著者: Michael A Robichaux / Valencia L Potter / Zhixian Zhang / Feng He / Jun Liu / Michael F Schmid / Theodore G Wensel / 要旨: Primary cilia carry out numerous signaling and sensory functions, and defects in them, "ciliopathies," cause a range of symptoms, including blindness. Understanding of their nanometer-scale ciliary ...Primary cilia carry out numerous signaling and sensory functions, and defects in them, "ciliopathies," cause a range of symptoms, including blindness. Understanding of their nanometer-scale ciliary substructures and their disruptions in ciliopathies has been hindered by limitations of conventional microscopic techniques. We have combined cryoelectron tomography, enhanced by subtomogram averaging, with superresolution stochastic optical reconstruction microscopy (STORM) to define subdomains within the light-sensing rod sensory cilium of mouse retinas and reveal previously unknown substructures formed by resident proteins. Domains are demarcated by structural features such as the axoneme and its connections to the ciliary membrane, and are correlated with molecular markers of subcompartments, including the lumen and walls of the axoneme, the membrane glycocalyx, and the intervening cytoplasm. Within this framework, we report spatial distributions of key proteins in wild-type (WT) mice and the effects on them of genetic deficiencies in 3 models of Bardet-Biedl syndrome. | ||||||||||||||||||
| 履歴 |
|
- 構造の表示
構造の表示
| ムービー |
 ムービービューア ムービービューア |
|---|---|
| 構造ビューア | EMマップ: SurfViewMolmilJmol/JSmol |
| 添付画像 |

- ダウンロードとリンク
-EMDBアーカイブ
| マップデータ | emd_8992.map.gz | 1.5 GB | EMDBマップデータ形式 | |
|---|---|---|---|---|
| ヘッダ (付随情報) | emd-8992-v30.xmlemd-8992.xml | 17.3 KB 17.3 KB | 表示 表示 | EMDBヘッダ |
| 画像 |  emd_8992.png emd_8992.png | 83.6 KB | ||
| その他 | emd_8992_additional_1.map.gzemd_8992_additional_2.map.gzemd_8992_additional_3.map.gz | 116.3 MB 1.3 GB 881.6 MB | ||
| アーカイブディレクトリ |  http://ftp.pdbj.org/pub/emdb/structures/EMD-8992ftp://ftp.pdbj.org/pub/emdb/structures/EMD-8992 http://ftp.pdbj.org/pub/emdb/structures/EMD-8992ftp://ftp.pdbj.org/pub/emdb/structures/EMD-8992 | HTTPS FTP |
-検証レポート
| 文書・要旨 | emd_8992_validation.pdf.gz | 78.3 KB | 表示 | EMDB検証レポート |
|---|---|---|---|---|
| 文書・詳細版 | emd_8992_full_validation.pdf.gz | 77.4 KB | 表示 | |
| XML形式データ | emd_8992_validation.xml.gz | 499 B | 表示 | |
| アーカイブディレクトリ | https://ftp.pdbj.org/pub/emdb/validation_reports/EMD-8992ftp://ftp.pdbj.org/pub/emdb/validation_reports/EMD-8992 | HTTPS FTP |
-リンク
| EMDBのページ | EMDB (EBI/PDBe) / EMDataResource |
|---|
-マップ
| ファイル | ダウンロード / ファイル: emd_8992.map.gz / 形式: CCP4 / 大きさ: 1.9 GB / タイプ: IMAGE STORED AS FLOATING POINT NUMBER (4 BYTES) | ||||||||||||||||||||||||||||||||||||||||||||||||||||||||||||||||||||
|---|---|---|---|---|---|---|---|---|---|---|---|---|---|---|---|---|---|---|---|---|---|---|---|---|---|---|---|---|---|---|---|---|---|---|---|---|---|---|---|---|---|---|---|---|---|---|---|---|---|---|---|---|---|---|---|---|---|---|---|---|---|---|---|---|---|---|---|---|---|
| 注釈 | Map derived from C9 sub-tomogram averaging of B04.mrc. Used to generate Fig. 1a(1,3) and 1b-1h. | ||||||||||||||||||||||||||||||||||||||||||||||||||||||||||||||||||||
| 投影像・断面図 | 画像のコントロール
画像は Spider により作成 | ||||||||||||||||||||||||||||||||||||||||||||||||||||||||||||||||||||
| ボクセルのサイズ | X=Y=Z: 8.9 Å | ||||||||||||||||||||||||||||||||||||||||||||||||||||||||||||||||||||
| 密度 |
| ||||||||||||||||||||||||||||||||||||||||||||||||||||||||||||||||||||
| 対称性 | 空間群: 1 | ||||||||||||||||||||||||||||||||||||||||||||||||||||||||||||||||||||
| 詳細 | EMDB XML:
CCP4マップ ヘッダ情報:
| ||||||||||||||||||||||||||||||||||||||||||||||||||||||||||||||||||||
 Z (Sec.)
 Y (Row.)
 X (Col.)


-添付データ
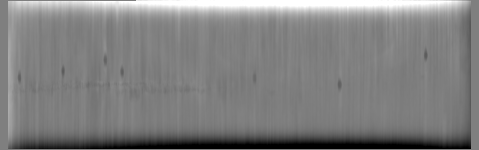
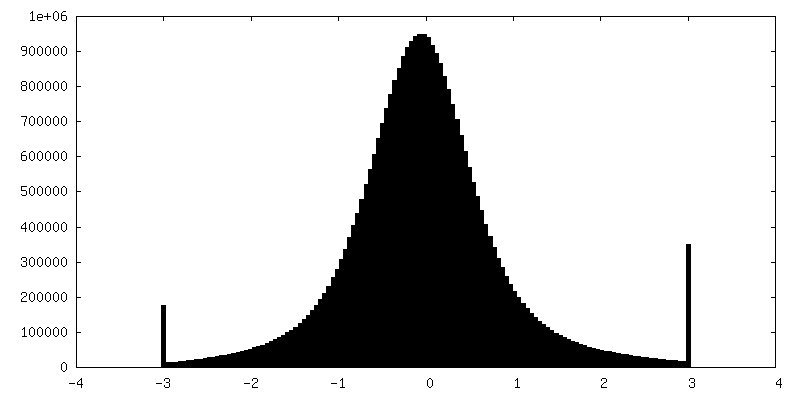
-追加マップ: Map constructed from IMOD. Used to generate Fig.1i (1).
| ファイル | emd_8992_additional_1.map | ||||||||||||
|---|---|---|---|---|---|---|---|---|---|---|---|---|---|
| 注釈 | Map constructed from IMOD. Used to generate Fig.1i (1). | ||||||||||||
| 投影像・断面図 |
| ||||||||||||
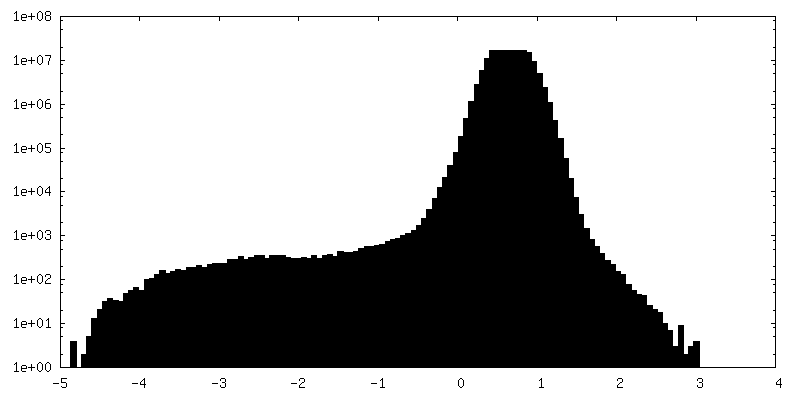
| 密度ヒストグラム |


-追加マップ: Map constructed from IMOD. Used to generate Fig. 1a(1,3).
| ファイル | emd_8992_additional_2.map | ||||||||||||
|---|---|---|---|---|---|---|---|---|---|---|---|---|---|
| 注釈 | Map constructed from IMOD. Used to generate Fig. 1a(1,3). | ||||||||||||
| 投影像・断面図 |
| ||||||||||||
| 密度ヒストグラム |


-追加マップ: Map constructed from IMOD. Used to generate Fig. 1i(3,4).
| ファイル | emd_8992_additional_3.map | ||||||||||||
|---|---|---|---|---|---|---|---|---|---|---|---|---|---|
| 注釈 | Map constructed from IMOD. Used to generate Fig. 1i(3,4). | ||||||||||||
| 投影像・断面図 |
| ||||||||||||
| 密度ヒストグラム |


- 試料の構成要素
-全体 : Base of connecting cilium and mother centriole of mouse rod cell.
| 全体 | 名称: Base of connecting cilium and mother centriole of mouse rod cell. |
|---|---|
| 要素 |
|
-超分子 #1: Base of connecting cilium and mother centriole of mouse rod cell.
| 超分子 | 名称: Base of connecting cilium and mother centriole of mouse rod cell. タイプ: organelle_or_cellular_component / ID: 1 / 親要素: 0 / 含まれる分子: #1 詳細: Mouse rod cell fragments were isolated by density gradient centrifugation and applied to EM grid for plunge freezing. |
|---|---|
| 由来(天然) | 生物種: |
-実験情報
-構造解析
| 手法 | クライオ電子顕微鏡法 |
|---|---|
 解析 解析 | 電子線トモグラフィー法 |
| 試料の集合状態 | cell |
-試料調製
| 緩衝液 | pH: 7.4 / 詳細: Ringer's buffer |
|---|---|
| グリッド | モデル: Quantifoil R2/2 / 材質: COPPER / メッシュ: 200 / 支持フィルム - 材質: CARBON / 支持フィルム - トポロジー: HOLEY / 前処理 - タイプ: GLOW DISCHARGE |
| 凍結 | 凍結剤: ETHANE / 装置: FEI VITROBOT MARK III |
| 詳細 | Isolate rod cell fragments applied to grid. |
| Cryo protectant | None- aqueous buffer |
| 切片作成 | その他: NO SECTIONING |
| 位置合わせマーカー | Manufacturer: Electron Microscopy Sciences / 直径: 15 nm |
- 電子顕微鏡法
| 顕微鏡 | FEI POLARA 300 |
|---|---|
| 撮影 | フィルム・検出器のモデル: GATAN K2 SUMMIT (4k x 4k) デジタル化 - 画像ごとのフレーム数: 1-8 / 平均電子線量: 1.4 e/Å2 |
| 電子線 | 加速電圧: 300 kV / 電子線源:  FIELD EMISSION GUN FIELD EMISSION GUN |
| 電子光学系 | 照射モード: FLOOD BEAM / 撮影モード: BRIGHT FIELD / 最小 デフォーカス(公称値): 0.009 µm / 倍率(公称値): 9400 |
| 試料ステージ | ホルダー冷却材: NITROGEN |
| 実験機器 | 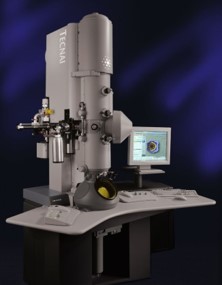 モデル: Tecnai Polara / 画像提供: FEI Company |
-画像解析
| 最終 再構成 | ソフトウェア: (名称: IMOD, EMAN2, UCSF Chimera) / 使用した粒子像数: 35 |
|---|
