eF-seek Help
How to use
STEP-1: Up load a PDB format file.
- Upload a PDB format file
- Input your e-mail address
- Optionally, you can give a title to your calculation (free format).
And press the Submit button. Then you will see a web page as follows;

STEP-2: Check an e-mail and access to the Job-start page
You will receive an e-mail like a ...

Please follow the link appeared in the e-mail ,then you will see the Job-start page as follows.
STEP-3: Start the calculation
As in the example of the Job-start page below, you will find a start button and a cancel button.
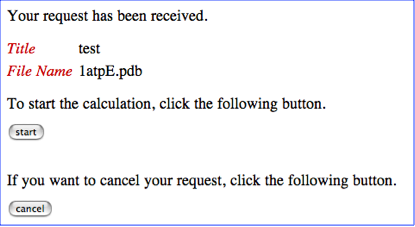
If the uploaded file name and title of your job is correct, please push the start button. Otherwise, please push the cancel button to cancel your job submission. If you push the start button, you will see the following Job-control page.
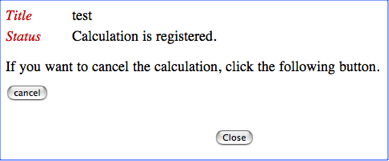
In this page you can see the status of the calculation.
STEP-4: Access to the calculation result
When the calculation is finished, you will receive another e-mail like a ...
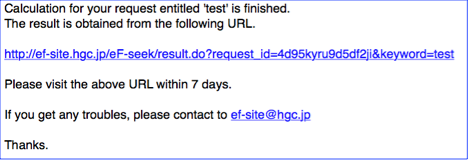
Please follow the link in the e-mail, you will reach to the result page as follows.
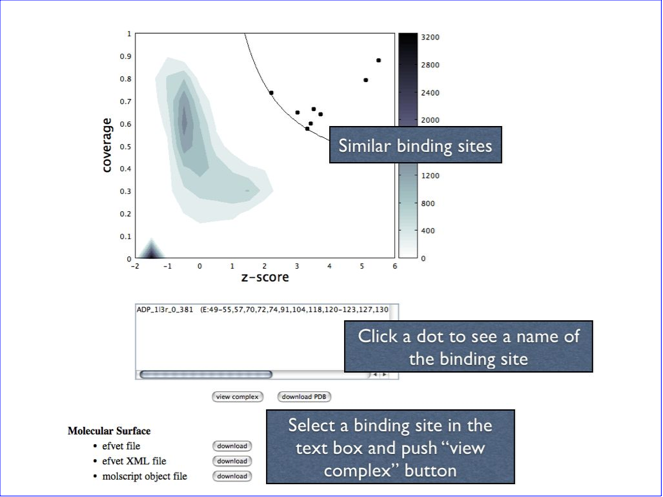
The density plot in the upper part is a result of the calculation. Please see “Kinoshita & Nakamura, Pro Sci, 14, 711-718, 2005” for detail, but briefly, the dots in the upper right regions are indicating “significantly” similar binding sites, and the lower left region indicates the non-similar binding sites.
In order to see the complex structure of these binding site on the query protein, please click one of the dot. Then you will see the name of the binding site in the text box just below the density plot. (When the dots are overlapped each other, then two or more names will appear on the text box.) You can select the name in the text box to see the complex structure with jV as below. Please note that you need to install Java to see this page, because the viewer of the density plot is a Java applet.
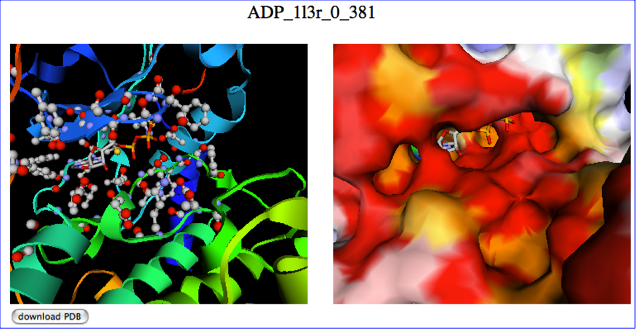
The predicted binding mode is shown as ribbon model (left) and surface model (right) with jV. The above figure is a snapshot, and you can access to the example interactive page from here.