 Movie
Movie Controller


+ Open data

- Basic information
| Entry | Database: EMDB / ID: EMD-6300 | |||||||||
|---|---|---|---|---|---|---|---|---|---|---|
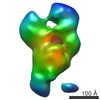
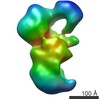
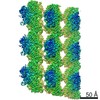
| Title | S. cerevisiae SAGA complex in the curved conformation | |||||||||
 Map data Map data | 3D reconstruction of the SAGA curved conformation | |||||||||
 Sample Sample |
| |||||||||
 Keywords Keywords | Histone acetyltransferase | |||||||||
| Biological species |  | |||||||||
| Method | single particle reconstruction / negative staining / Resolution: 41.7 Å | |||||||||
 Authors Authors | Setiaputra D / Ross JD / Lu S / Cheng DT / Dong MQ / Yip CK | |||||||||
 Citation Citation | Journal: J Biol Chem / Year: 2015 Title: Conformational flexibility and subunit arrangement of the modular yeast Spt-Ada-Gcn5 acetyltransferase complex. Authors: Dheva Setiaputra / James D Ross / Shan Lu / Derrick T Cheng / Meng-Qiu Dong / Calvin K Yip /   Abstract: The Spt-Ada-Gcn5 acetyltransferase (SAGA) complex is a highly conserved, 19-subunit histone acetyltransferase complex that activates transcription through acetylation and deubiquitination of ...The Spt-Ada-Gcn5 acetyltransferase (SAGA) complex is a highly conserved, 19-subunit histone acetyltransferase complex that activates transcription through acetylation and deubiquitination of nucleosomal histones in Saccharomyces cerevisiae. Because SAGA has been shown to display conformational variability, we applied gradient fixation to stabilize purified SAGA and systematically analyzed this flexibility using single-particle EM. Our two- and three-dimensional studies show that SAGA adopts three major conformations, and mutations of specific subunits affect the distribution among these. We also located the four functional modules of SAGA using electron microscopy-based labeling and transcriptional activator binding analyses and show that the acetyltransferase module is localized in the most mobile region of the complex. We further comprehensively mapped the subunit interconnectivity of SAGA using cross-linking mass spectrometry, revealing that the Spt and Taf subunits form the structural core of the complex. These results provide the necessary restraints for us to generate a model of the spatial arrangement of all SAGA subunits. According to this model, the chromatin-binding domains of SAGA are all clustered in one face of the complex that is highly flexible. Our results relate information of overall SAGA structure with detailed subunit level interactions, improving our understanding of its architecture and flexibility. | |||||||||
| History |
|
- Structure visualization
| Movie |
 Movie viewer Movie viewer |
|---|---|
| Structure viewer | EM map: SurfViewMolmilJmol/JSmol |
| Supplemental images |
 UCSF Chimera
- Downloads & links
-EMDB archive
| Map data | emd_6300.map.gz | 7.4 MB | EMDB map data format | |
|---|---|---|---|---|
| Header (meta data) | emd-6300-v30.xmlemd-6300.xml | 9.8 KB 9.8 KB | Display Display | EMDB header |
| Images |  400_6300.gif 400_6300.gif 80_6300.gif 80_6300.gif | 49.5 KB 3.8 KB | ||
| Archive directory |  http://ftp.pdbj.org/pub/emdb/structures/EMD-6300ftp://ftp.pdbj.org/pub/emdb/structures/EMD-6300 http://ftp.pdbj.org/pub/emdb/structures/EMD-6300ftp://ftp.pdbj.org/pub/emdb/structures/EMD-6300 | HTTPS FTP |
-Validation report
| Summary document | emd_6300_validation.pdf.gz | 78.8 KB | Display | EMDB validaton report |
|---|---|---|---|---|
| Full document | emd_6300_full_validation.pdf.gz | 77.9 KB | Display | |
| Data in XML | emd_6300_validation.xml.gz | 494 B | Display | |
| Arichive directory | https://ftp.pdbj.org/pub/emdb/validation_reports/EMD-6300ftp://ftp.pdbj.org/pub/emdb/validation_reports/EMD-6300 | HTTPS FTP |
-Related structure data


-Links
| EMDB pages | EMDB (EBI/PDBe) / EMDataResource |
|---|
-Map
| File | Download / File: emd_6300.map.gz / Format: CCP4 / Size: 7.8 MB / Type: IMAGE STORED AS FLOATING POINT NUMBER (4 BYTES) | ||||||||||||||||||||||||||||||||||||||||||||||||||||||||||||
|---|---|---|---|---|---|---|---|---|---|---|---|---|---|---|---|---|---|---|---|---|---|---|---|---|---|---|---|---|---|---|---|---|---|---|---|---|---|---|---|---|---|---|---|---|---|---|---|---|---|---|---|---|---|---|---|---|---|---|---|---|---|
| Annotation | 3D reconstruction of the SAGA curved conformation | ||||||||||||||||||||||||||||||||||||||||||||||||||||||||||||
| Voxel size | X=Y=Z: 4.67 Å | ||||||||||||||||||||||||||||||||||||||||||||||||||||||||||||
| Density |
| ||||||||||||||||||||||||||||||||||||||||||||||||||||||||||||
| Symmetry | Space group: 1 | ||||||||||||||||||||||||||||||||||||||||||||||||||||||||||||
| Details | EMDB XML:
CCP4 map header:
| ||||||||||||||||||||||||||||||||||||||||||||||||||||||||||||
-Supplemental data
- Sample components
-Entire : The curved conformation of the yeast SAGA complex
| Entire | Name: The curved conformation of the yeast SAGA complex |
|---|---|
| Components |
|
-Supramolecule #1000: The curved conformation of the yeast SAGA complex
| Supramolecule | Name: The curved conformation of the yeast SAGA complex / type: sample / ID: 1000 / Number unique components: 1 |
|---|---|
| Molecular weight | Theoretical: 1.7 MDa |
-Macromolecule #1: Spt-Ada-Gcn5 Acetyltransferase Complex
| Macromolecule | Name: Spt-Ada-Gcn5 Acetyltransferase Complex / type: protein_or_peptide / ID: 1 / Name.synonym: SAGA Details: Samples were prepared using gradient fixation using a glycerol gradient and glutaraldehyde. Recombinant expression: No / Database: NCBI |
|---|---|
| Source (natural) | Organism: |
| Molecular weight | Theoretical: 1.7 MDa |
-Experimental details
-Structure determination
| Method | negative staining |
|---|---|
 Processing Processing | single particle reconstruction |
| Aggregation state | particle |
-Sample preparation
| Buffer | pH: 7.4 Details: 40 mM HEPES, 150 mM NaCl, 20% glycerol, 0.1% Tween-20, 0.015% glutaraldehyde |
|---|---|
| Staining | Type: NEGATIVE Details: Grids with adsorbed protein were used to scoop a carbon layer floating on 0.75% w/v uranyl formate, sandwiching the protein and a layer of stain between two carbon layers. |
| Grid | Details: 400 mesh copper grid with holey carbon support, glow discharged |
| Vitrification | Cryogen name: NONE / Instrument: OTHER |
- Electron microscopy
| Microscope | FEI TECNAI SPIRIT |
|---|---|
| Temperature | Average: 298 K |
| Details | Low dose |
| Date | Feb 10, 2013 |
| Image recording | Category: CCD / Film or detector model: FEI EAGLE (4k x 4k) / Digitization - Sampling interval: 1.3 µm / Number real images: 382 / Average electron dose: 25 e/Å2 / Bits/pixel: 16 |
| Tilt angle max | 0 |
| Electron beam | Acceleration voltage: 120 kV / Electron source: LAB6 |
| Electron optics | Calibrated magnification: 65900 / Illumination mode: FLOOD BEAM / Imaging mode: BRIGHT FIELD / Nominal defocus max: 1.2 µm / Nominal defocus min: 0.8 µm / Nominal magnification: 49000 |
| Sample stage | Specimen holder: Side entry room temperature tomography holder Specimen holder model: SIDE ENTRY, EUCENTRIC / Tilt angle min: -65 |
| Experimental equipment | 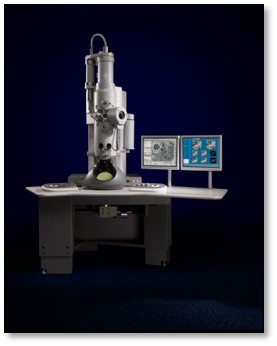 Model: Tecnai Spirit / Image courtesy: FEI Company |
-Image processing
| Details | Particles were selected manually. |
|---|---|
| Final reconstruction | Algorithm: OTHER / Resolution.type: BY AUTHOR / Resolution: 41.7 Å / Resolution method: OTHER / Software - Name: Spider Details: The initial map was made using back-projection of tilted data, and was subjected to an angular refinement cycle with the same data set. The model then underwent a final refinement cycle with ...Details: The initial map was made using back-projection of tilted data, and was subjected to an angular refinement cycle with the same data set. The model then underwent a final refinement cycle with both tilted and untilted data. The model was then filtered to the calculated resolution. Number images used: 22518 |
