 Movie
Movie Controller

[English] 日本語
 Yorodumi
- EMDB-5132: The reconstructed F120 amyloid fibril represents the structure of... -
+ Open data

- Basic information
| Entry | Database: EMDB / ID: EMD-5132 | |||||||||
|---|---|---|---|---|---|---|---|---|---|---|
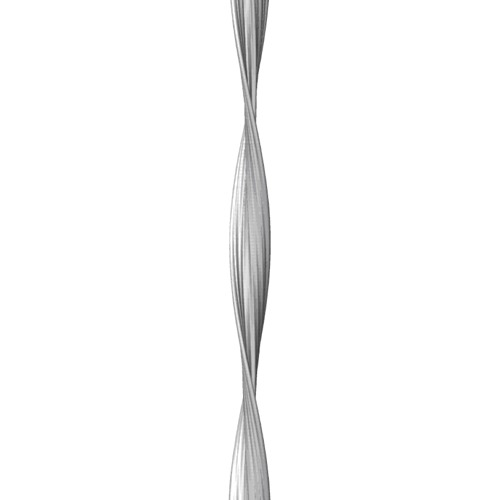
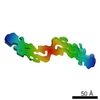
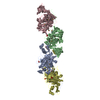
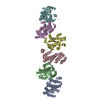
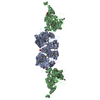
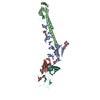
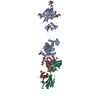
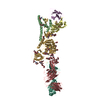
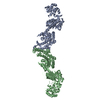
| Title | The reconstructed F120 amyloid fibril represents the structure of a selected subpopulation from the Abeta(1-40) fibril sample with a mean crossover distance of 120 nm. The F140 subpopulation with a mean crossover distance of 140 nm had been studied and deposited previously (EMDB accession no. 5008). | |||||||||
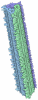
 Map data Map data | Cross-sectional density slice of the F120 amyloid fibril of 24 Angstrom thickness. F120 corresponds to a subpopulation of the Abeta(1-40) amyloid fibril sample with a mean crossover distance of 120 nm. | |||||||||
 Sample Sample |
| |||||||||
 Keywords Keywords |  Alzheimer's disease / micromechanical properties / electron cryo-microscopy / amyloid fibrils Alzheimer's disease / micromechanical properties / electron cryo-microscopy / amyloid fibrils | |||||||||
| Biological species |  Homo sapiens (human) Homo sapiens (human) | |||||||||
| Method | helical reconstruction / cryo EM / negative staining / Resolution: 10.1 Å | |||||||||
 Authors Authors | Sachse C / Faendrich M / Grigorieff N | |||||||||
 Citation Citation | Journal: Angew Chem Int Ed Engl / Year: 2010 Title: Nanoscale flexibility parameters of Alzheimer amyloid fibrils determined by electron cryo-microscopy. Authors: Carsten Sachse / Nikolaus Grigorieff / Marcus Fändrich /  | |||||||||
| History |
|
- Structure visualization
| Movie |
 Movie viewer Movie viewer |
|---|---|
| Structure viewer | EM map: SurfViewMolmilJmol/JSmol |
| Supplemental images |
- Downloads & links
-EMDB archive
| Map data | emd_5132.map.gz | 285.4 KB | EMDB map data format | |
|---|---|---|---|---|
| Header (meta data) | emd-5132-v30.xmlemd-5132.xml | 10.2 KB 10.2 KB | Display Display | EMDB header |
| Images | emd_5132_1.tif | 54.7 KB | ||
| Archive directory |  http://ftp.pdbj.org/pub/emdb/structures/EMD-5132ftp://ftp.pdbj.org/pub/emdb/structures/EMD-5132 http://ftp.pdbj.org/pub/emdb/structures/EMD-5132ftp://ftp.pdbj.org/pub/emdb/structures/EMD-5132 | HTTPS FTP |
-Related structure data
| Similar structure data |
|---|
-Links
| EMDB pages | EMDB (EBI/PDBe) / EMDataResource |
|---|---|
| Related items in Molecule of the Month |
-Map
| File | Download / File: emd_5132.map.gz / Format: CCP4 / Size: 306.6 KB / Type: IMAGE STORED AS FLOATING POINT NUMBER (4 BYTES) | ||||||||||||||||||||||||||||||||||||||||||||||||||||||||||||
|---|---|---|---|---|---|---|---|---|---|---|---|---|---|---|---|---|---|---|---|---|---|---|---|---|---|---|---|---|---|---|---|---|---|---|---|---|---|---|---|---|---|---|---|---|---|---|---|---|---|---|---|---|---|---|---|---|---|---|---|---|---|
| Annotation | Cross-sectional density slice of the F120 amyloid fibril of 24 Angstrom thickness. F120 corresponds to a subpopulation of the Abeta(1-40) amyloid fibril sample with a mean crossover distance of 120 nm. | ||||||||||||||||||||||||||||||||||||||||||||||||||||||||||||
| Voxel size | X=Y=Z: 2.4 Å | ||||||||||||||||||||||||||||||||||||||||||||||||||||||||||||
| Density |
| ||||||||||||||||||||||||||||||||||||||||||||||||||||||||||||
| Symmetry | Space group: 1 | ||||||||||||||||||||||||||||||||||||||||||||||||||||||||||||
| Details | EMDB XML:
CCP4 map header:
| ||||||||||||||||||||||||||||||||||||||||||||||||||||||||||||
-Supplemental data
- Sample components
-Entire : Human Abeta (1-40)
| Entire | Name: Human Abeta (1-40) |
|---|---|
| Components |
|
-Supramolecule #1000: Human Abeta (1-40)
| Supramolecule | Name: Human Abeta (1-40) / type: sample / ID: 1000 / Oligomeric state: helical / Number unique components: 1 |
|---|---|
| Molecular weight | Theoretical: 4.33 KDa |
-Macromolecule #1: Abeta
| Macromolecule | Name: Abeta / type: protein_or_peptide / ID: 1 / Name.synonym: Abeta / Recombinant expression: No / Database: NCBI |
|---|---|
| Source (natural) | Organism: Homo sapiens (human) / synonym: Human |
-Experimental details
-Structure determination
| Method | negative staining, cryo EM |
|---|---|
 Processing Processing | helical reconstruction |
| Aggregation state | filament |
-Sample preparation
| Concentration | 1 mg/mL |
|---|---|
| Buffer | pH: 8.7 / Details: 50 mM Borate |
| Staining | Type: NEGATIVE / Details: Blot for 7 seconds before plunging |
| Grid | Details: Quantifoil 400 mesh 1.3 micrometer holes |
| Vitrification | Cryogen name: ETHANE / Chamber temperature: 77.2 K / Instrument: HOMEMADE PLUNGER Details: Vitrification instrument: custom-built plunging apparatus. in coldroom at 277 K. Method: Blot for 7 seconds before plunging |
- Electron microscopy
| Microscope | FEI TECNAI F30 |
|---|---|
| Electron beam | Acceleration voltage: 300 kV / Electron source: FIELD EMISSION GUN |
| Electron optics | Calibrated magnification: 58333 / Illumination mode: FLOOD BEAM / Imaging mode: BRIGHT FIELDBright-field microscopy / Cs: 2 mm / Nominal defocus max: 3.5 µm / Nominal defocus min: 1.9 µm / Nominal magnification: 59000 |
| Sample stage | Specimen holder: Side entry liquid nitrogen-cooled cryo specimen holder Specimen holder model: GATAN LIQUID NITROGEN |
| Temperature | Average: 93 K |
| Alignment procedure | Legacy - Astigmatism: objective lens astigmatism was corrected at 200,000 times magnification |
| Date | Nov 9, 2005 |
| Image recording | Category: FILM / Film or detector model: KODAK SO-163 FILM / Digitization - Scanner: ZEISS SCAI / Digitization - Sampling interval: 7 µm / Number real images: 62 / Average electron dose: 35 e/Å2 |
| Experimental equipment |  Model: Tecnai F30 / Image courtesy: FEI Company |
-Image processing
| CTF correction | Details: Each particle CTFTILT |
|---|---|
| Final angle assignment | Details: one-degree sampling around helical axis, out-of-plane tilt 16 degree deviation (in 1 degree steps) |
| Final reconstruction | Applied symmetry - Helical parameters - Δz: 4.8 Å Applied symmetry - Helical parameters - Axial symmetry: C2 (2 fold cyclic )Algorithm: OTHER / Resolution.type: BY AUTHOR / Resolution: 10.1 Å / Resolution method: OTHER / Software - Name: SPIDER |
| Details | The fibrils in the sample were selected based on their uniform width. 2. The F120 subset of limited crossover distances (110-130 nm) was chosen for the reconstruction. |
